
Figure 3.
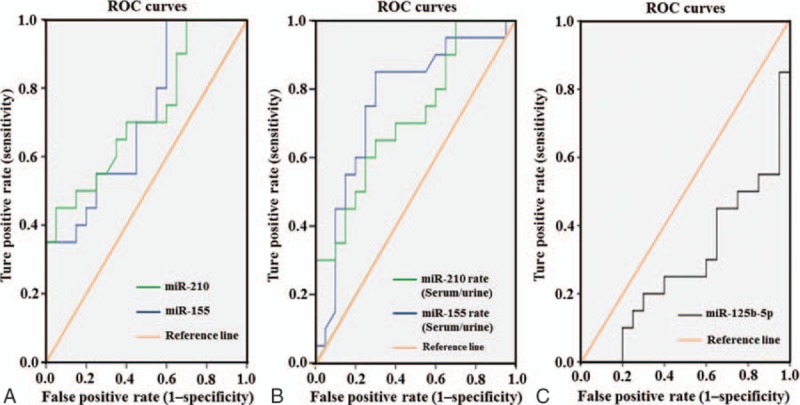
ROC curve analysis for candidate miRNAs between the cases of PE pregnancies and healthy pregnancies. The ROC display the true positive rates versus the false positive rates (i.e., “sensitivity” versus “1–specificity”). The reference line represents the ROC curve for a statistical test with the controls. The AUC (areas under the ROC curve) of miRNA-210 and miR-155 were 0.724 (P = .015, CI = 0.567–0.881) and 0.715 (P = .020, CI = 0.556–0.874), respectively (A). The AUC of the expression rates of miRNA-210 (serum/urine) and miRNA-155 (serum/urine) were 0.761 (P = .005, CI = 0.605–0.917 and 0.718 (P = .019, CI = 0.560–0.875), respectively (B). However, the AUC of miR-125b-5p was 0.290 (C). The AUC between 0.5 and 1 was considered having diagnostic significance. AUC = area under the curve, CI = confidence interval, miRNA = micro ribonucleic acid, PE = pre-eclampsia, ROC = receiver operating characteristic.