Figure 2.

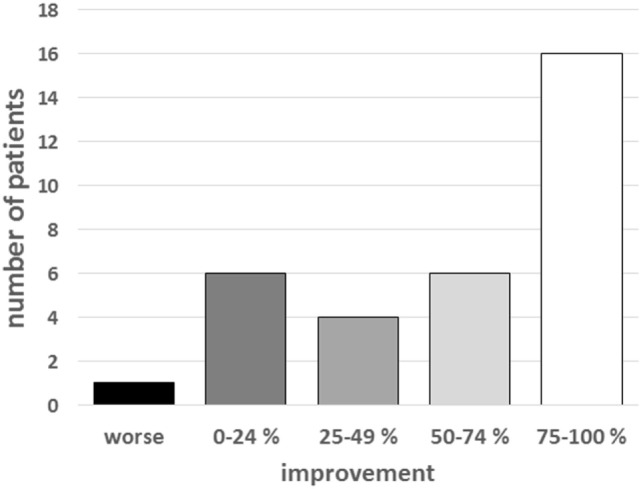
Patient distribution according to the degree of improvement on day 3. The chart represents the numbers of patients who were improved by >75, 50–75, 25–50, and <25%.

Patient distribution according to the degree of improvement on day 3. The chart represents the numbers of patients who were improved by >75, 50–75, 25–50, and <25%.