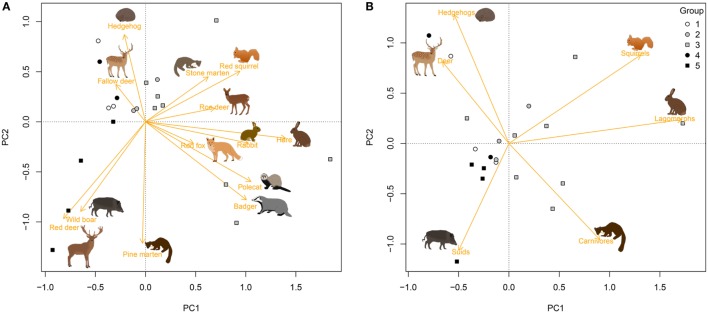
Figure 1.
Differences in passage rate of medium- to large-sized mammals among 20 forest plots in the Netherlands, estimated with camera traps placed at 18 random points per plot. Graphs show the first two axes of a Principal Component Analysis (PCA) for (A) species and (B) taxonomic groups (orange vectors). White symbols refer to plots without ungulates, gray symbols to plots in which roe deer (Capreolus capreolus) was the only ungulate species, and black symbols to plots with two to four ungulate species. See Table 2 for an explanation of group numbers.

