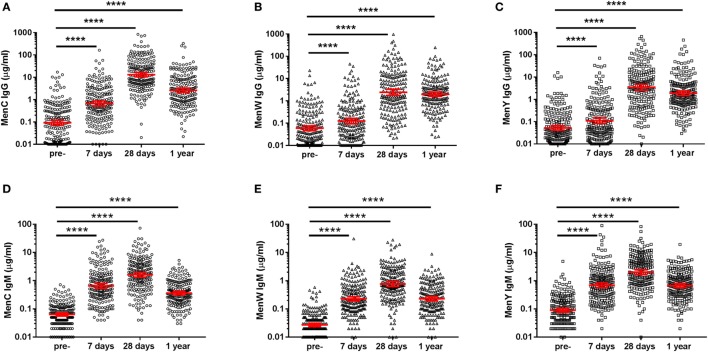
Figure 2.
MenCWY-specific IgG and IgM responses. MenC (A), MenW (B), MenY (C) polysaccharide-specific IgG, and MenC (D), MenW (E), MenY (F) polysaccharide-specific IgM responses pre- and post-vaccination. The lines indicate the geometric mean concentrations with 95% CI intervals. The different time points were compared with the repeated measured ANOVA, which was highly significant for all comparisons (p < 0.0001), after which pairwise comparisons between the time points were performed.

