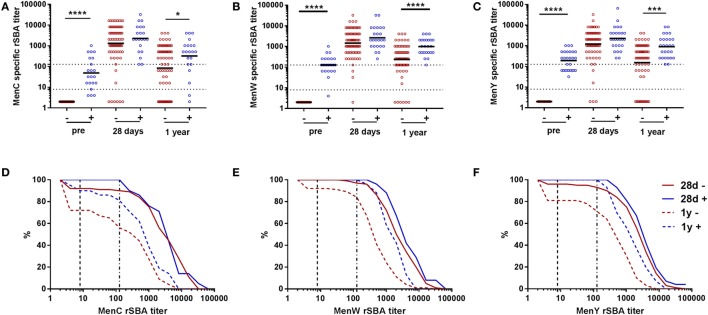
Figure 3.
MenCWY serum bactericidal antibody responses in participants with and without pre-vaccination rSBA titers. MenC (A), MenW (B), and MenY (C) specific rSBA responses at the different time points for pre-vaccination seronegative (−, red) and seropositive (+, blue) participants. The geometric mean titers are indicated. The seronegative and seropositive participants were compared at the different time points using the Mann–Whitney U test *p < 0.05, ***p < 0.001, and ****p < 0.0001. Reverse cumulative distribution graphs at day 28 and 1 year post-vaccination for MenC (D), MenW (E), and MenY (F) separated for the pre-vaccination seronegative (red) and seropositive (blue) participants.

