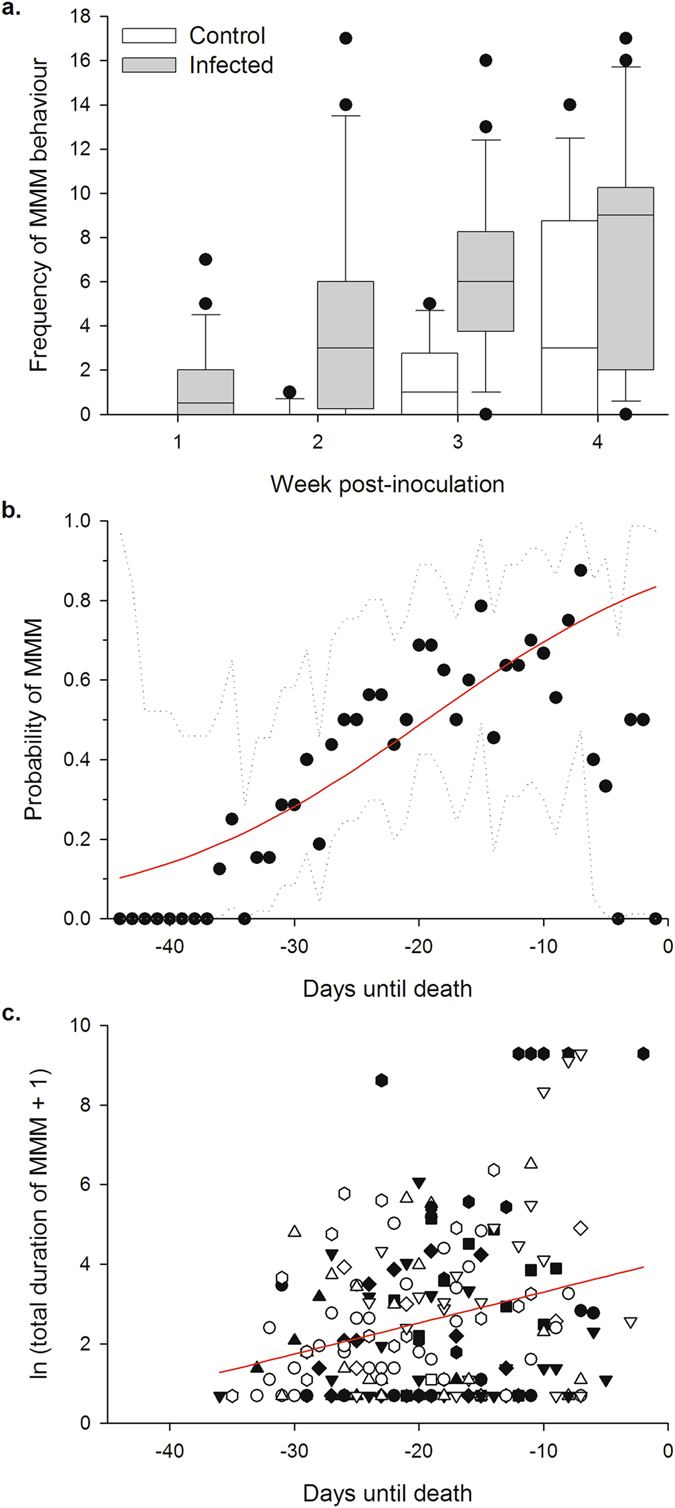
Figure 1.

Male-male mounting behaviour in fungus-infected and control locusts. (a) Frequency of MMM behaviour observed in 24 fungus-infected and 12 control locusts over a 28-day period following inoculation. MMM behaviour frequencies were observed for 3 hours each day, and are summed over each week post-inoculation. Boxes denote the median, 25th and 75th percentile values, whiskers the 5th and 95th percentile values, and circles the more extreme observations. Note that two fungus-infected locusts died during the experiment, resulting in a sample size of 22 for that treatment in weeks three and four. (b) Probability of fungus-infected locusts mounting another male according to the time remaining until their death, for the 16 locusts from panel (a) that died during days 29–45 post inoculation. Points show the proportion of locusts performing at least one instance of MMM behaviour on a particular day before death. Because the sample size of locusts that were observed at a particular day before death varied according to their actual time of death, the resulting 95% binomial confidence intervals are plotted as dotted lines. The red line represents the fitted probability of performing MMM behaviour according to binary logistic GEE analysis (see text). (c) Natural log (x + 1) transformed duration of total time spent mounting other males for each locust that performed MMM behaviour on a particular day in panel (b), according to the time remaining until its death. Observations from the same individual have the same symbol and fill. Red line indicates the fitted relationship according to GEE analysis (see text).
