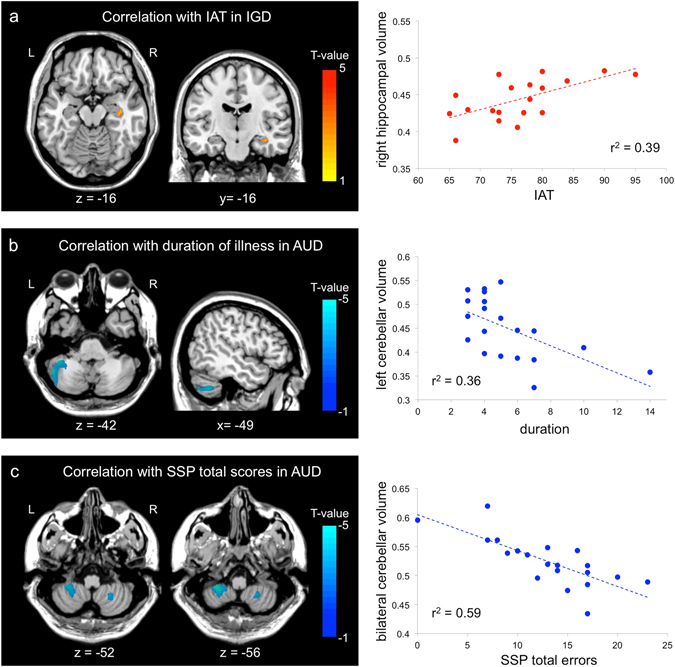
Figure 3.

Brain regions showing significant correlations between gray matter volume and clinical characteristics or cognitive function. (a) The brain region showed positive correlations with scores of Young’s Internet addiction test in Internet gaming disorder group (IGD). The scatter plot at right depicts the relation between mean gray matter volume from the significant cluster and IAT scores in IGD. (b) The brain regions showed negative correlation with addiction duration of alcohol use disorder (AUD). The scatter plot at right depicts the relation between mean gray matter volume from the significant cluster and addiction duration of AUD. (c) The brain regions showed negative correlation with total errors of spatial span in AUD group. The scatter plot at right depicts the relation. These correlations were not significant after correctios for multiple comparisons. between mean gray matter volume from the significant cluster and total errors of spatial span in AUD group. AUD, alcohol use disorder; IGD, Internet gaming disorder; IAT, Young’s Internet addiction test; SSP, spatial span.
