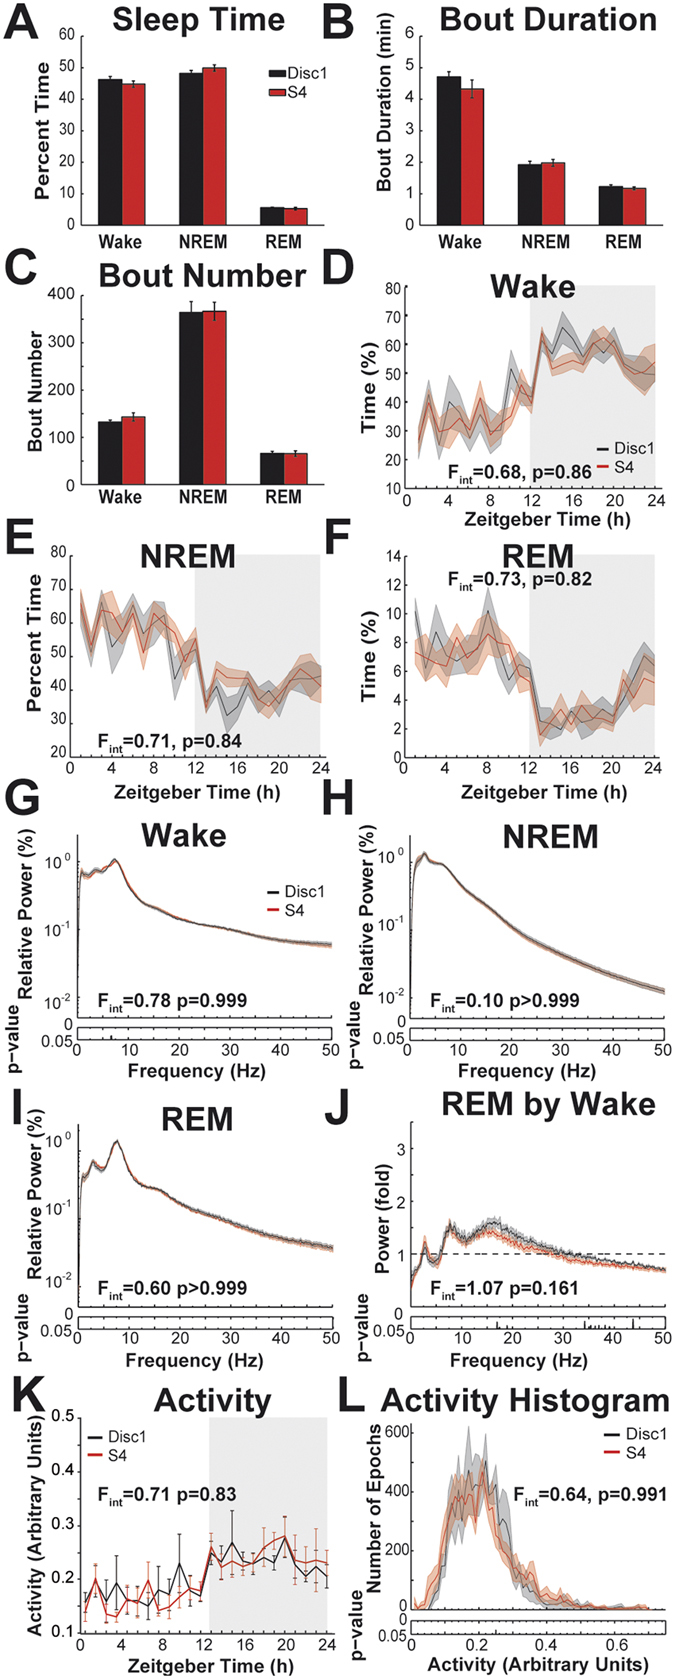
Figure 3.

Vigilance states of S4 and S4-Disc1 mice during 24 h undisturbed baseline. This figure directly parallels the comparisons made between S4 and B6 in Fig. 1. (A) Percentage of time spent in wake, NREM, and REM. (B) Average durations of the bouts of each state. (C) Average number of bouts during baseline. (D) Wake time across the 24 h in 1 h bins. Curves depict group averages, shaded areas depict s.e.m. Shaded rectangle indicates lights off. F-values for interactions of factors ‘time’ and ‘strain’ are indicated in the panels. Degrees of freedom for ANOVAs in D-F are 23, 276. (E) NREM time across the 24 h. (F) REM time across the 24 h. (G-I) EEG power spectra. The power in one frequency bin is expressed as percentage of the cumulative power of all frequencies (0–50 Hz). Curves depict group averages, shaded areas depict s.e.m. Interactions of factors ‘frequency’ and ‘genotype’ (permutation ANOVA) are indicated for each panel. The degrees of freedom are 409 and 4908 for interactions in G-J. The p-values for post hoc uncorrected bin-by-bin t-tests are indicated below the spectra (G) Average wake power spectra (H) Average NREM EEG power spectra. (I) Average REM EEG power spectra. (J) Average REM EEG power spectra normalized by the respective wake power spectra. (K) Average activity during baseline in 1 h bins. Error bars depict s.e.m. F-value for interaction between factors ‘time’ and ‘strain’ is in the panel. Degrees of freedom are 23, 276. (L) Frequency time histogram (71 bins) of activity during baseline. Curves depict group averages, shaded areas depict s.e.m. F for interaction of factors ‘activity level’ and ‘genotype’ (permutation ANOVA) is indicated in the panel. Degrees of freedom are 70, 840.
