
Figure 1.
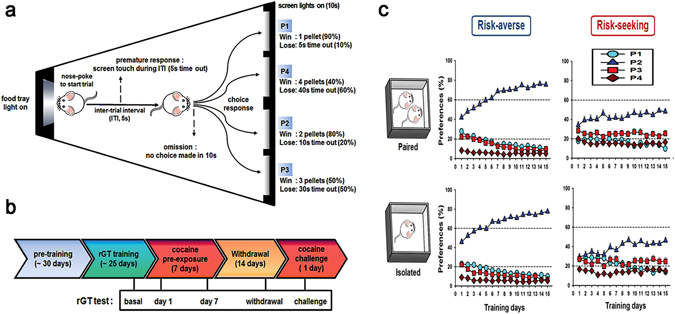
Rat gambling task apparatus, experimental schemes, and basal preference scores. (a) Schematic diagram of the rGT chamber, where a food magazine unit (left) and 4 response windows (right) are shown. Each window is represented as P1 through P4 with a different number of pellets, duration of time-out, and frequencies. (b) Time lines for the experimental procedures when the rGT tests were conducted are indicated. (c) Data obtained during the 15 consecutive days of stage 6 rGT training clearly show different preferences of choice between the groups. The risk-averse group overwhelmingly and consistently chose P2 over the other windows more than 60% of the choices after 6 days, whereas the risk-seeking group chose P2 less than 60% of the choices throughout the training days. The choice of P3 in the risk-averse group never increased more than 20% after 5 days of training, whereas it was always higher than 20% in the risk-seeking group throughout all the training days. There were no significant differences between the paired and isolated groups. However, there were small differences such as the choice of P3 decreased less than 20% faster in the isolated group than in the paired group (risk-averse), the choice of P1 decreased less than 20% later, and the choice of P2 was relatively a little lower in the isolated group than in the paired group (risk-seeking). The numbers of rats in each group were as follows: averse-paired (16), averse-isolated (20), seeking-paired (14), and seeking-isolated (16).