
Figure 2.
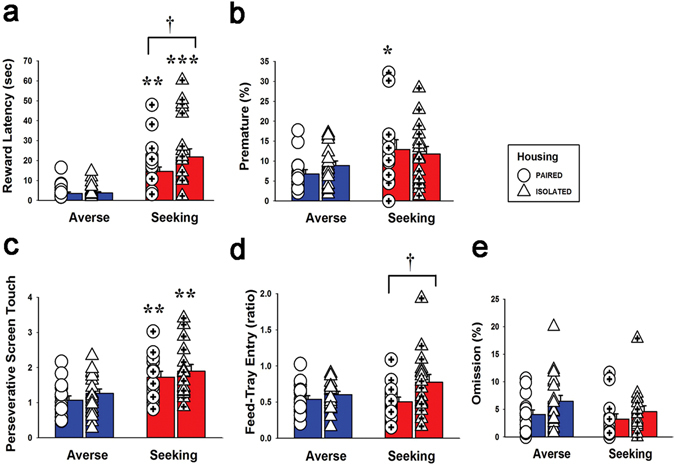
Analysis of behavioral parameters for the data obtained during the basal stage. The numbers of rats in each group were as shown in Fig. 1c. Values are expressed as mean + standard error of the mean. (a) Reward latency. **p < 0.01; significantly higher in the seeking-paired than in the averse-paired group. ***p < 0.001; significantly higher in the seeking-isolated than in the averse-isolated group. † p < 0.05; significant differences between the seeking-paired and seeking-isolated groups. (b) Premature response. *p < 0.05; significantly higher in the seeking-paired compared to the averse-paired group. (c) Perseverative screen touch. **p < 0.01; significantly higher in the seeking-paired compared to the averse-paired group. **p < 0.01; significantly higher in the seeking-isolated compared to the averse-isolated group. (d) Feed-tray entry. † p < 0.05; significant differences between the seeking-paired and seeking-isolated groups. (e) Omission. There was no significant difference between groups.