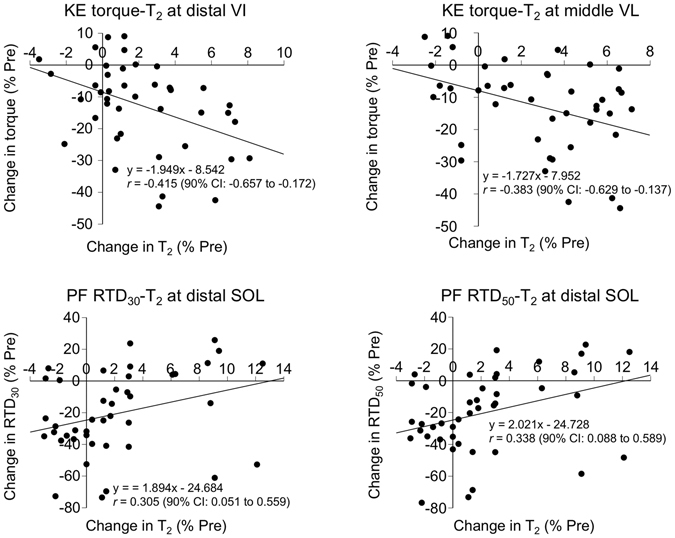
Figure 3.

Relationships between changes in maximal torque of the KEs and T2 at the distal VI (top left) and at the middle VL (top right), between changes in RTD30 of the PFs and T2 at the distal SOL (bottom left), and between changes in RTD50 of the PFs and T2 at the distal SOL (bottom right). KEs: knee extensors, PFs: plantar flexors, RTD30,50: rate of torque development in the time intervals of 0–30 and 0–50 ms, respectively, from contraction onset. Each graph has 42 plots (14 participants × 3 time points post-exercise).
