Figure 1.

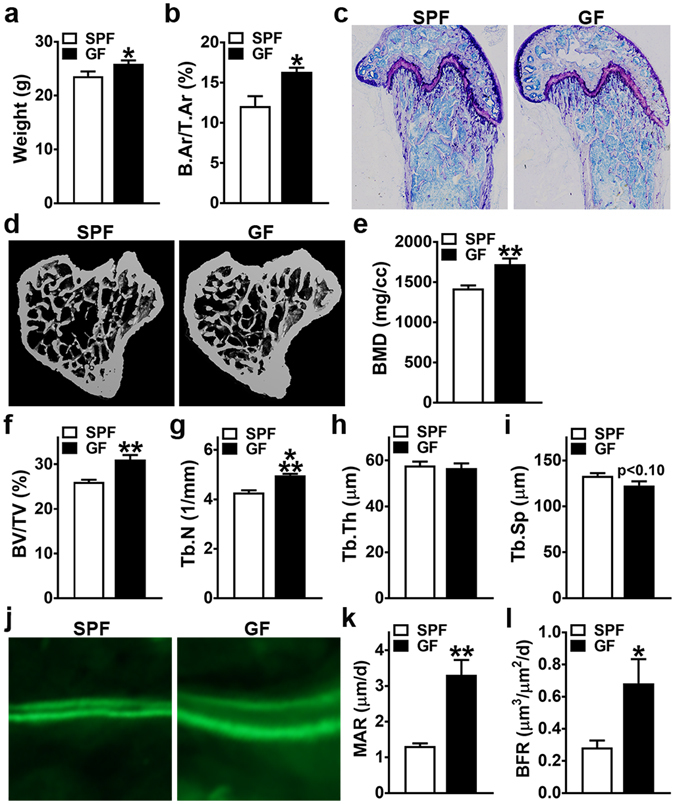
Animal weight and trabecular bone analysis. 11 to 12 week-old male SPF & GF mice were weighed; euthanized; femur harvested for histomorphometric analysis and tibia harvested for micro-CT analysis. (a) Animal weight (n = 12/gp). (b,c) Static histomorphometric analysis of distal femur trabecular bone area (n = 4/gp). (b) B.Ar/T.Ar = bone area. (c) Representative images (100×) of toluidine blue stained distal femur sections. (d–i) Micro-CT analysis of proximal tibia trabecular bone (n = 4/gp). (d) Representative reconstructed cross-sectional images, extending 360 µm distally from where analysis was initiated. (e) BMD = trabecular bone mineral density. (f) BV/TV = trabecular bone volume fraction. (g) Tb.N = trabecular number. (h) Tb.Th = trabecular thickness. (i) Tb.Sp = trabecular separation. (j–l) Dynamic histomorphometric analysis of bone formation indices in distal femur trabecular bone; calcein administered 5 and 2 days prior to sacrifice (n = 4/gp). (j) Representative images of calcein labeled secondary spongiosa (400×). (k) MAR = mineral apposition rate. (l) BFR = bone formation rate. Data reported as mean ± SEM. *p < 0.05 vs. SPF; **p < 0.01 vs. SPF; ***p < 0.001 vs SPF.
