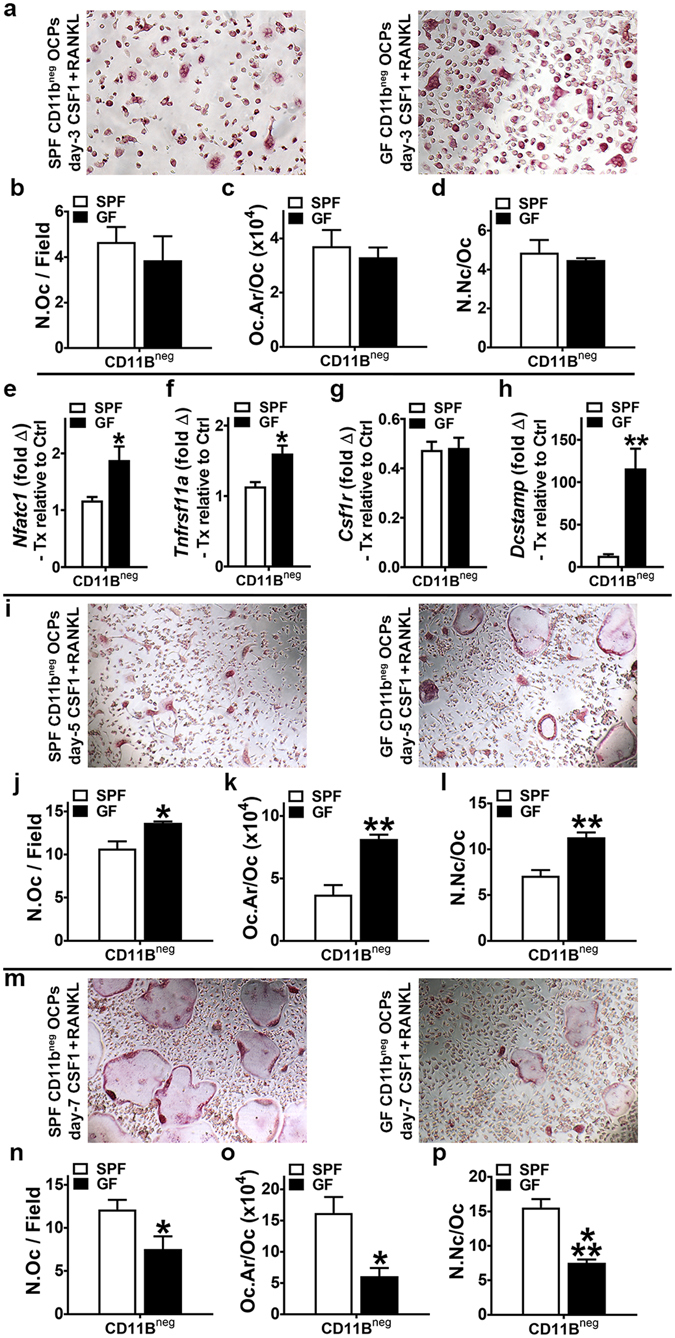
Figure 4.

Osteoclast-precursor (OCP) differentiation assays. (a–p) 11 week-old male SPF & GF mice were euthanized; bone marrow harvested; hematopoietic progenitor cells (HPCs) isolated. Magnetic cell sorting was applied to separate CD11bneg HPCs, which were then stimulated in culture (primed with CSF1) to enrich for CD11bneg osteoclast-precursor (OCP) cells having high osteoclastic potential. CD11bneg OCP cultures were then stimulated with control (CSF1 alone) or treatment (CSF1 & RANKL) media for 3, 5 and 7 days. Cytomorphometric cellular differentiation endpoints were analyzed in TRAP stained CD11bneg OCP cultures at day-3, day-5, and day-7 to evaluate cell level alterations in RANKL-induced osteoclast differentiation; TRAP + cell with > 3 nuclei considered an osteoclast. Gene expression studies were carried out in CD11bneg OCP cultures at day-3 to detect early transcription level alterations in RANKL-stimulated osteoclast differentiation. (a–d) Day-3 TRAP stain assay (n = 4/gp). (a) Representative images (200X) of CD11bneg OCP cultures stimulated with treatment (CSF1 & RANKL) media for 3 days. (b) N.Oc/Field = number of osteoclasts per field of view. (c) Oc.Ar/Oc = average osteoclast area. (d) N.Nc/Oc = nuclei number per osteoclast. (e–h) Day-3 qRT-PCR gene expression assay (n = 4/gp). (e) Nfatc1 mRNA. (f) Tnfrsf11a mRNA. (g) Csf1r mRNA. (h) Dcstamp mRNA. Relative quantification of mRNA was performed via the comparative C T method (ΔΔCT); Gapdh was utilized as an internal control gene; data expressed as treatment (CSF1 and RANKL) fold change relative to control (CSF1). (i–l) Day-5 TRAP stain assay (n = 4/gp). (i) Representative images (100×) of CD11bneg OCP cultures stimulated with treatment (CSF1 & RANKL) media for 5 days. (j) N.Oc/Field. (k) Oc.Ar/Oc. (l) N.Nc/Oc. (m–p) Day-7 TRAP stain assay (n = 4/gp). (m) Representative images (100×) of CD11bneg OCP cultures stimulated with treatment (CSF1 & RANKL) media for 7 days. (n) N.Oc/Field. (o) Oc.Ar/Oc. (p) N.Nc/Oc. Gene expression assay performed in duplicate (two technical replicate) cultures. TRAP stain assays performed in triplicate (three technical replicate) cultures; three fields of view analyzed per technical replicate culture. n-values represent biological replicates per group. Data reported as mean ± SEM. *p < 0.05 vs. SPF; **p < 0.01 vs. SPF; ***p < 0.001 vs SPF.
