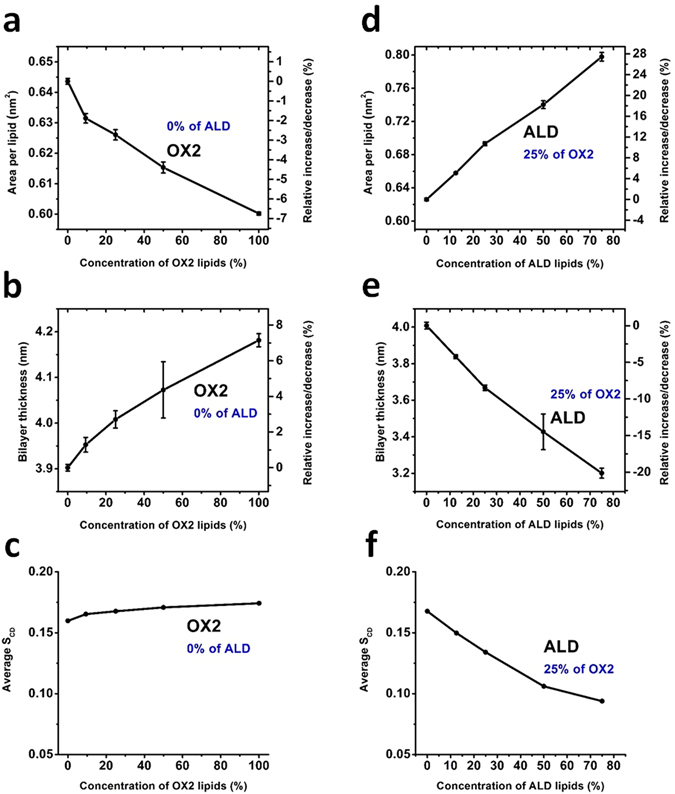
Figure 6.

Surface area per lipid (a) and (d), thickness of the bilayer (b) and (e) and average deuterium order parameter (c) and (f), as a function of the concentration of the oxidized PLs, for two types of oxidation products, for the DOPC PLB. Note that (a)–(c) illustrate the properties of the DOPC PLB with only OX2 oxidation, whereas (d–f) show the results of combined effects of ALD and OX2. In this case the concentration of ALD ranges between 0–75%, while keeping that of OX2 at 25%.
