FIGURE 1.

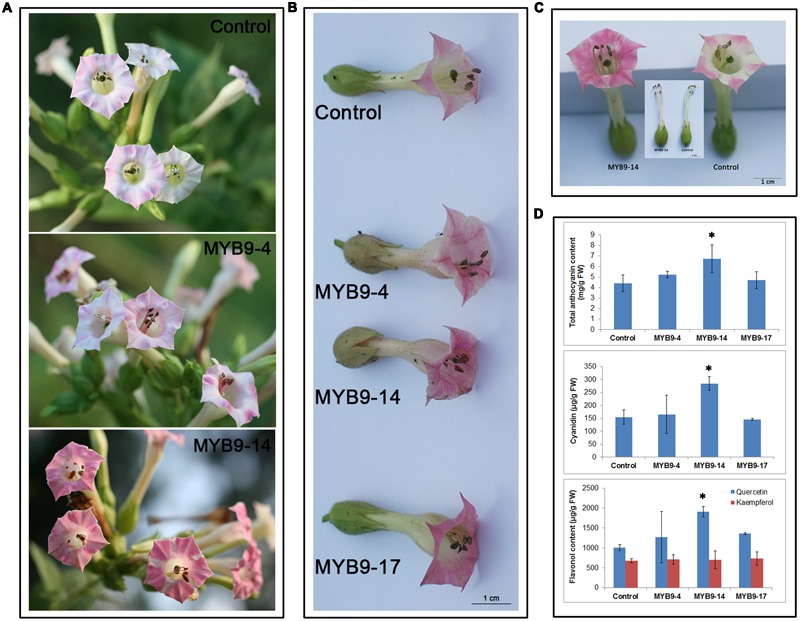
Phenotype observation and flavonoid content measurement in transgenic tobacco overexpressing EsMYB9 gene. Three representative independent transgenic tobacco lines carrying EsMYB9 gene (MYB9-4, -14, and -17) and the transgenic tobacco carrying the empty vector as the control plant are indicated. Flowers on plants of the T1 transgenic tobacco lines (A), flowers removed from the T2 transgenic tobacco lines (B), comparison of flowers of the T2 MYB9-14 line with the strongest change of phenotype and control plant (C), and flavonoid content (D), including total anthocyanin, cyanidin, and flavonol in transgenic tobacco flowers are showed. Each column represents mean values with SD bar from three biological replicates for each sample. Asterisk indicates a significant difference from the control plant (P < 0.05, LSD test).
