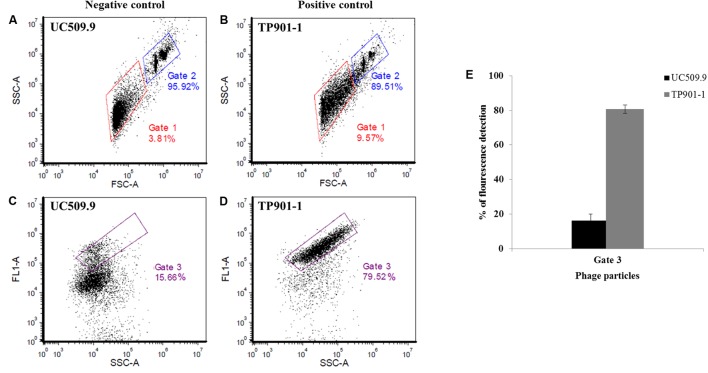
FIGURE 2.
Representative cytograms for SYTO9-stained samples of two L. lactis controls using the BD AccuriTM C6 flow cytometer. (A,C) Cytograms of MmC-treated L. lactis UC509.9 (prophage-free lactococcal strain used as negative control); (B,D) Cytogram of MmC-treated L. lactis NZ9000-TP901-1erm (lactococcal strain harboring the TP901-1 prophage used as a positive control); (A,B) Representative cytograms of the gating strategy for size discrimination between the phage-containing (induced) sample (Gate 1, red) and the control 6.0 μm microsphere suspension (Gate 2, blue), using SSC (Side Scattered light) versus FSC (Forward Scattered light) analysis. (C,D) Representative cytogram for the measurement of fluorescence detection (FL1/SYTO-9) in the phage population versus SSC, identified in Gate 1 in (A,B) mentioned above, which was subsequently selected in Gate 3 (purple). Gate 3 was applied to identify the percentage of fluorescence detected by phage DNA- containing particles stained with SYTO-9. (E) Percentage of SYTO-9 fluorescence detected in the Gate 3 applied in two inducible L. lactis strains (positive and negative control) using 3 μg.ml-1 of MmC.

