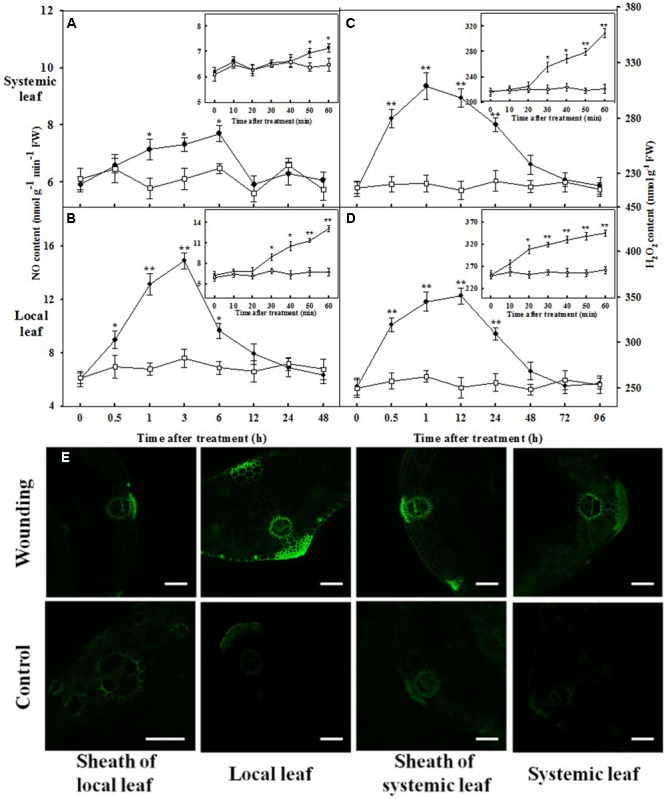
FIGURE 7.

Kinetics of changes in NO content, H2O2 content and imagines of H2O2 localization in the vascular tissues in response to mechanical wounding. The local (fourth) leaf was wounded and then harvested at indicated times after wounding treatment. NO and H2O2 content of the local or systemic leaf of wounded (circles) and untreated (squares) plants were assayed. Time zero points represent without wounding treatment. The top and bottom graphs represent the systemic and local leaves, respectively (A–D). Data are means ± SD of three different replicates. Insets: the average ± SE of two treatments in which the samples were harvested with an interval of 10 min for a better understanding of NO and H2O2 accumulation. Significance of variance for one-way ANOVA is indicated: ∗P < 0.05; ∗∗P < 0.01. (E) The roots of the whole seedlings were incubated into H2DCF-DA over night. The local leaf was prior wounded, after which the leaves and stems were sliced 3 h later and detected by a CLSM (excitation, 480 nm; emission, 530 nm). Bars, 100 μm.
