
. 2017 Jul 19;8:1272. doi: 10.3389/fpls.2017.01272
Copyright © 2017 Nelson and Oliver.
This is an open-access article distributed under the terms of the Creative Commons Attribution License (CC BY). The use, distribution or reproduction in other forums is permitted, provided the original author(s) or licensor are credited and that the original publication in this journal is cited, in accordance with accepted academic practice. No use, distribution or reproduction is permitted which does not comply with these terms.
FIGURE 5.
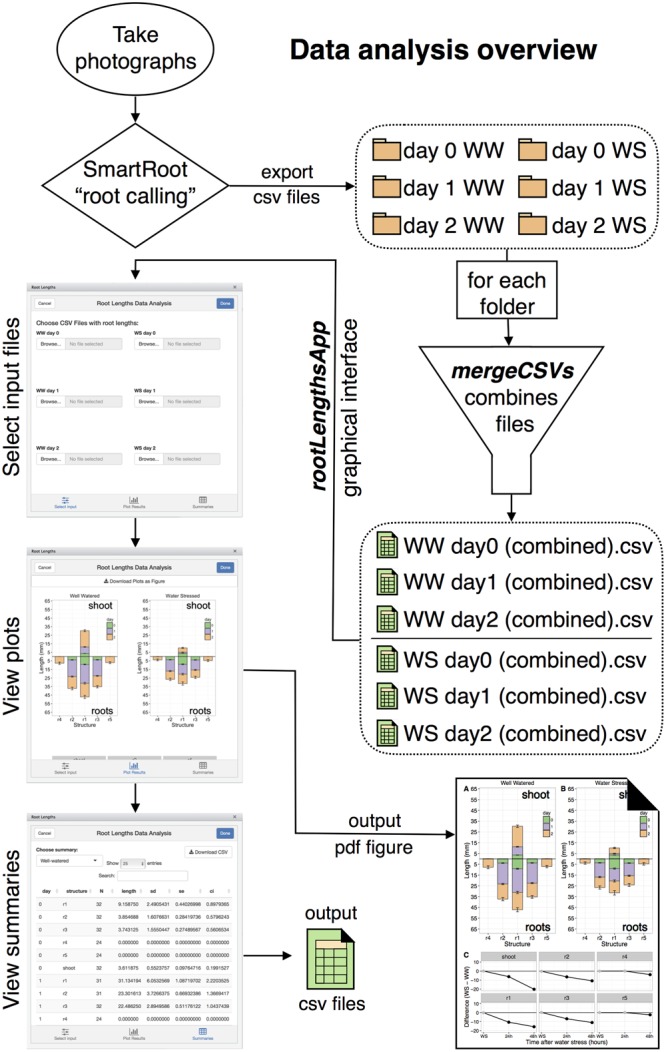
Diagram of the data analysis pipeline.