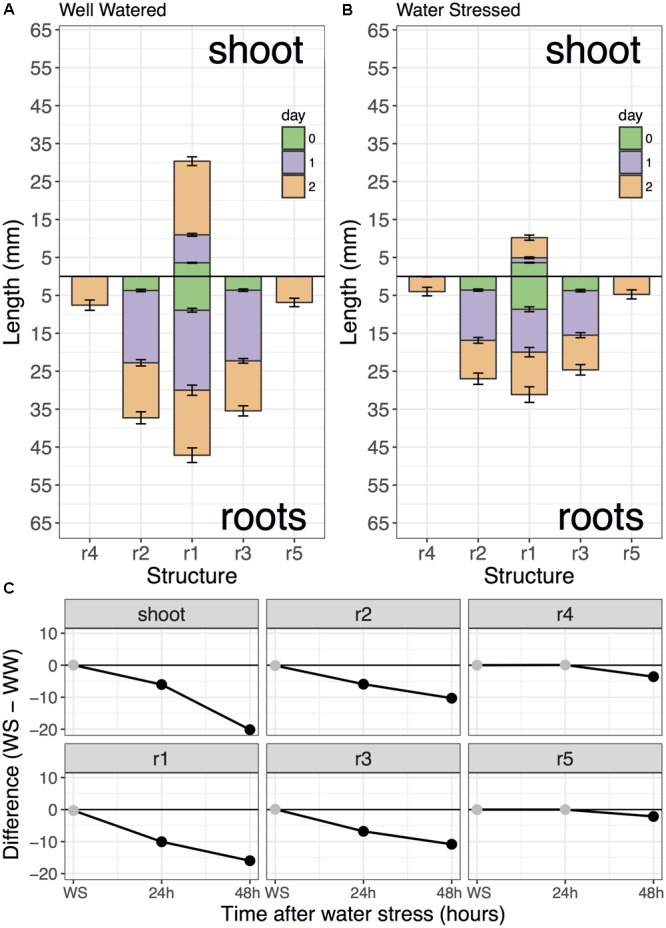
FIGURE 7.

Comparison of WW and WS seedling root growth. This figure was output directly from the rootLengthsApp function. Well-watered (A) Zak wheat was compared to –0.65 MPa water stressed (B) seedlings. (C) Difference plot shows the difference in root or shoot length at each time-point and indicates significance with black dots (p < 0.05).
