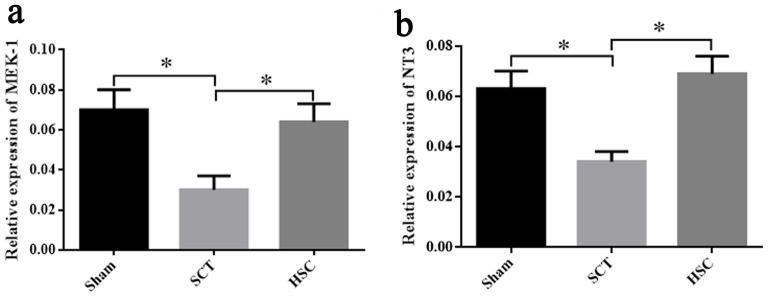
Figure 11.
Detection of neurotrophin-3 (NT-3) and mitogenactivated protein kinase kinase-1 (MEK-1) expression after HSC transplantation. The expressional changes of MEK-1 and NT-3 mRNA among the sham, SCT and HSC group at 24 weeks post-SCT were respectively shown in (A,B). *p < 0.05 compared with SCT group. Data are presented as the means ± SEM (n = 8). One-way ANOVA was used to analyze the data.

