
Figure 1.
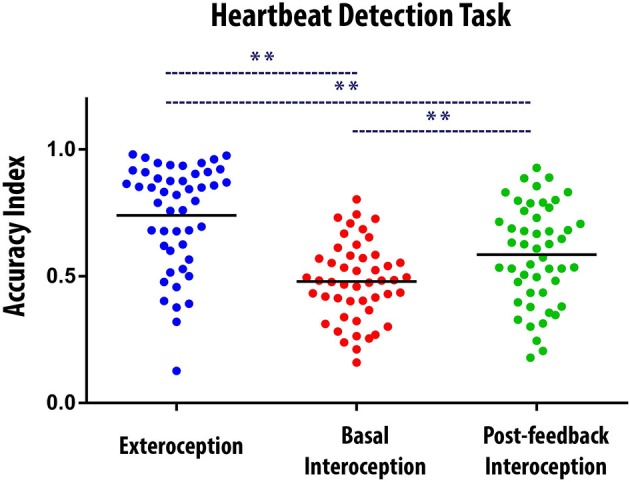
Behavioral results of the Heartbeat Detection (HBD) task. Dots show the mean performance of each subject for each condition (i.e., the average of the two blocks of each condition). The Accuracy Index can vary between 0 and 1, with higher scores indicating better interoceptive accuracy. ** Indicates significant differences between the conditions, set at p < 0.05. The black bars indicate the mean of the data distribution.