
Figure 7.
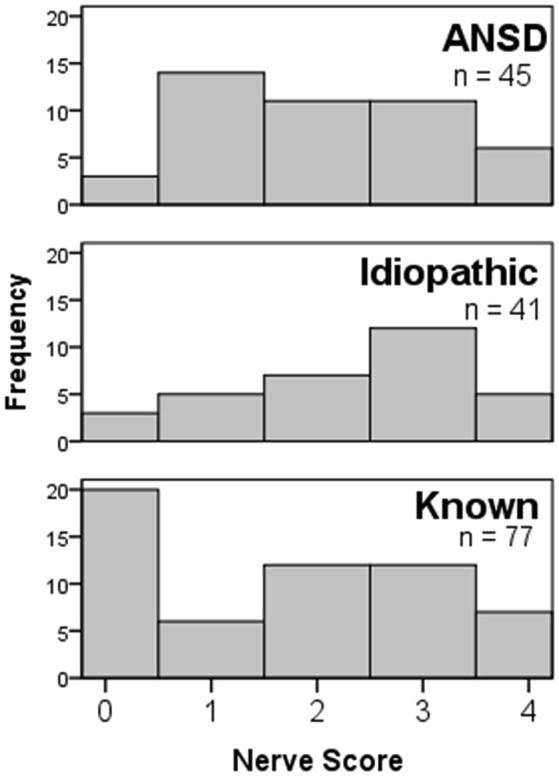
Nerve score distributions for children with different etiologies of hearing loss. All groups showed the full range of nerve scores, and the distribution in the ANSD group was not significantly different from the others.
Official websites use .gov
A
.gov website belongs to an official
government organization in the United States.
Secure .gov websites use HTTPS
A lock (
) or https:// means you've safely
connected to the .gov website. Share sensitive
information only on official, secure websites.
Nerve score distributions for children with different etiologies of hearing loss. All groups showed the full range of nerve scores, and the distribution in the ANSD group was not significantly different from the others.