Figure 2.

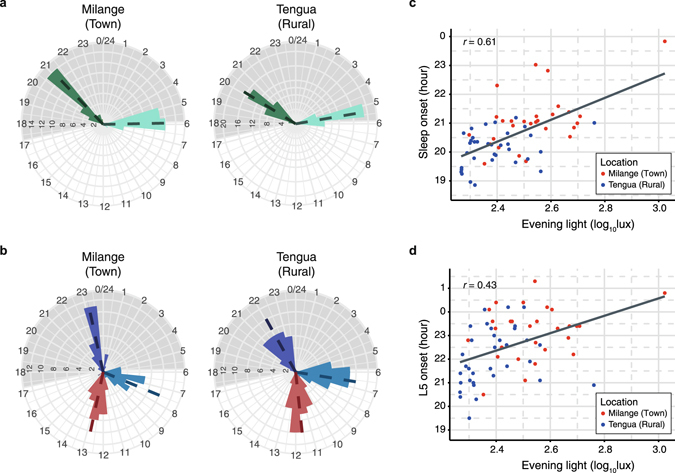
Phase of sleep and activity and amount of evening light exposure. (a,b) are circular histograms shown according to clock time where frequencies of temporal activity distributions are shown as distances from the centre. (a) Residents of Milange displayed a delayed onset of sleep (green) and a delayed wake up time (light green) compared to residents of Tengua. (b) Residents of Milange displayed a delayed M10 activity onset (light blue), a delayed L5 activity onset (purple) and a delayed centre of gravity for activity (red) relative to residents of Tengua. In (a,b) means (dotted lines) and histograms with 45 min bins (bars, counts on circumferences) are shown according to 24-h clock time (hours on radii). Grey shading represents average night duration. Sleep onset time (c) and L5 onset time (d) correlated with total exposure to light after sunset. Evening light exposure is distributed by location (Milange, red; Tengua, blue).
