
Figure 6.
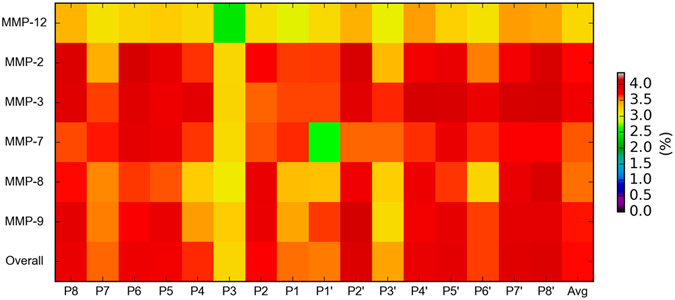
Heatmaps of cleavage entropies of MMP-2, -3, -7, -8, -9, -12, and the overall MMPs. The cleavage entropies of P8-P8′ positions surrounding the cleavage sites were calculated. The average values over all the P8-P8′ positions for each MMP were also calculated (indicated as “Avg”). Red colors indicate residue positions with larger cleavage entropy values (i.e. the corresponding protease has a higher cleavage specificity), while light yellow or green colors indicate residue positions with smaller cleavage entropy values (i.e. the corresponding protease has a lower cleavage specificity).