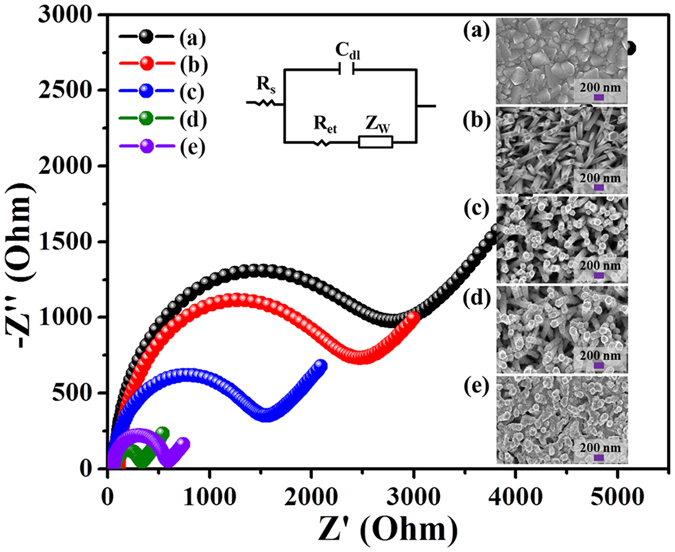
Figure 4.

Typical Nyquist semicircle plots of EIS spectra. Electrode fabrication step measured in a mixture of 5 mM [Fe(CN)6]3-/4- and 0.1 M KCl solutions at an applied amplitude of ± 5 mV within a frequency range of 0.01 Hz-100 MHz. (a) Bare FTO electrode, (b) ZnO NRs/FTO electrode, (c) 10 s CuO modified ZnO NRs/FTO electrode, (d) 20 s CuO modified ZnO NRs/FTO electrode, and (e) 30 s CuO modified ZnO NRs/FTO electrode. Inset FESEM images show the surface morphology of the electrodes. Randles equivalent circuit model is shown in inset, where Cdl, Rs, Ret, and Zw are double layer capacitor, solution resistor, electron transfer resistance, Warburg resistor, respectively.
