
Figure 2.
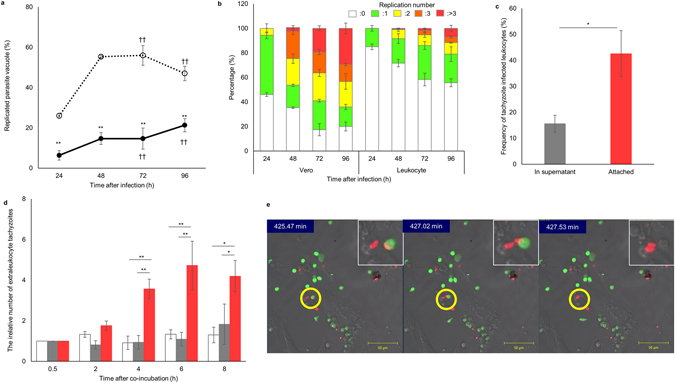
Adhesion to endothelial cells triggers tachyzoite egress from infected leukocytes. (a) The percentage of parasite vacuoles including replicated tachyzoites in Vero cells (dotted line) and leukocytes (solid line). Results are presented as the mean ± S.E. Data were from three independent experiments and were analysed using two-way ANOVA. Scheffe F-test was performed as a post hoc analysis. **Statistical difference between leukocytes and Vero cells (p < 0.01). ††Statistical difference compared with 24 h post infection (p < 0.01). (b) Replication times of tachyzoites in each vacuole. Results are presented as the mean ± S.E. White: 0, green: 1, yellow: 2, orange: 3, red: ≥4. Data are from three independent experiments. (c) Attachment of tachyzoite-infected leukocytes to lung endothelial cells. Tachyzoite-infected leukocytes, with an infection rate of 7.3–25.1%, were co-cultured with lung endothelial cells for 30 min. The frequencies of infected leukocytes among leukocytes in the supernatant (grey bar) and those attached to lung endothelial cells (red bar) are shown. Results are presented as the mean ± S.E. Data were from five independent experiments and were analysed using the Student’s t-test (*p < 0.05). (d) The relative number of extraleukocytic tachyzoites during in vitro culture of tachyzoite-infected leukocytes. The number of extraleukocytic tachyzoites in each culture 0.5 h after infection was considered as “1”. Infected leukocytes were cultured alone (white), cultured with lung endothelial cells separated by 0.4-µm mesh (grey) or attached to lung endothelial cells (red). Results are presented as the mean ± S.E. Data were from five independent experiments and were analysed using the Student’s t-test adjusted with the Holm method. Statistical differences were calculated at each time point (*p < 0.05, **p < 0.01). (e) Egress of a single tachyzoite from an infected leukocyte attached to lung endothelial cells.