
Figure 1.
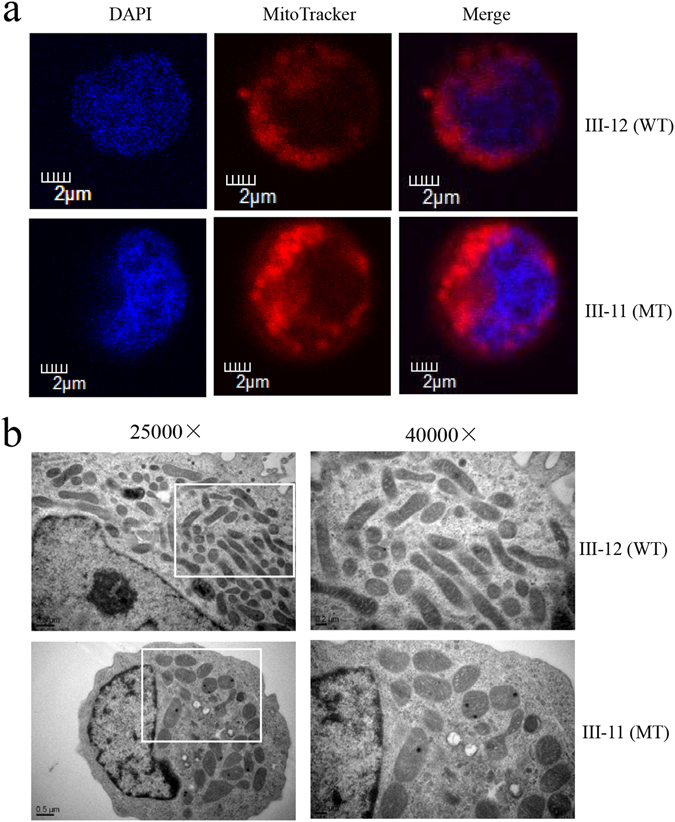
The OPA1 mutation altered the fragmentation of the mitochondrial network. (a) Mitochondrial morphology was visualized by immunofluorescent labeling with MitoTracker (red) and was analyzed by confocal microscopy using lymphoblastoid cell lines. DAPI-stained nuclei were identified by their blue fluorescence. Internal control cell (III-12) lacking the OPA1 mutation exhibited a balanced mitochondrial network of the filamentous and fragmented states. Cells carrying the OPA1 mutation (III-11) displayed a distinct punctate pattern of mitochodnria. (b) Mitochondrial networks from patient and control cells were examined by transmission electron microscopy. Ultrathin sections were stained with uranyl acetate and alkaline lead citrate. 25,000X and 40,000X magnifications were used. Control lymphoblastoid cell lines (III-12) have tubular distribution of mitochondria. Patient-derived lymphoblastoid cell lines (III-11) have spotty distribution of mitochondria.