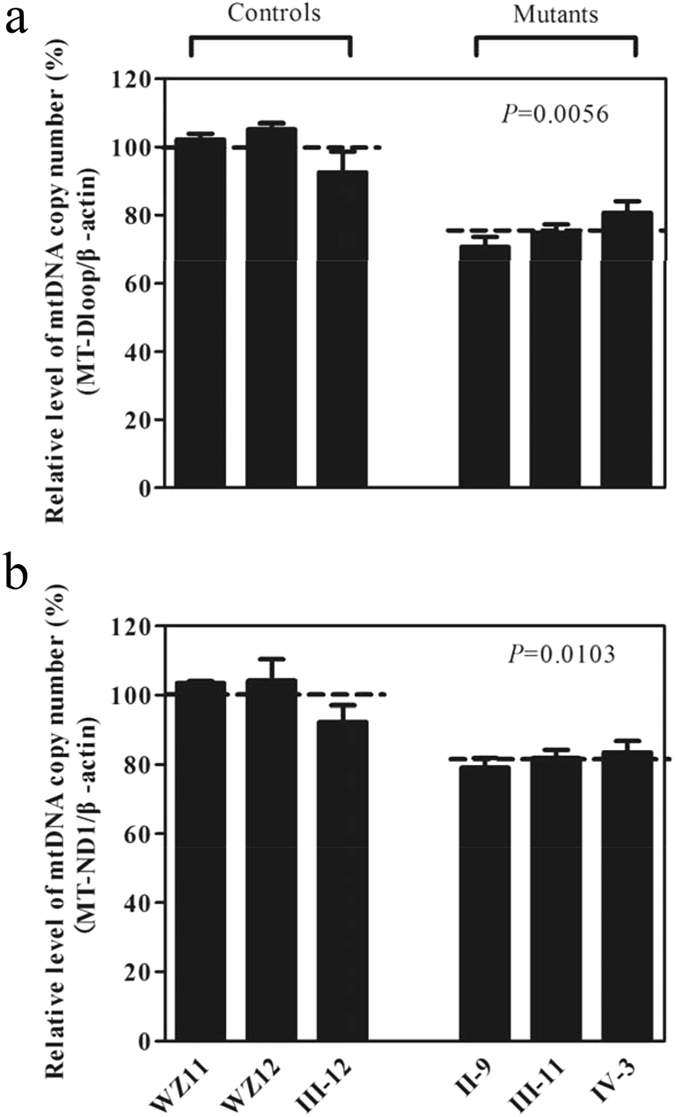
Figure 2.

Measurements of mtDNA copy numbers in lymphoblastoid cell lines. The mtDNA copy numbers were determined by comparing the ratio of mtDNA to nDNA (β-actin) by real-time quantitative PCR. (a) The ratio of MT-D-loop region to β-actin. (b) The ratio of MT-ND1 to β-actin. The calculations were based on three independent determinations. The error bars indicate two standard errors of the mean (SEM). P indicates the significance, according to the Student t-test, of the differences between the mean of mutant and that of control cell lines.
