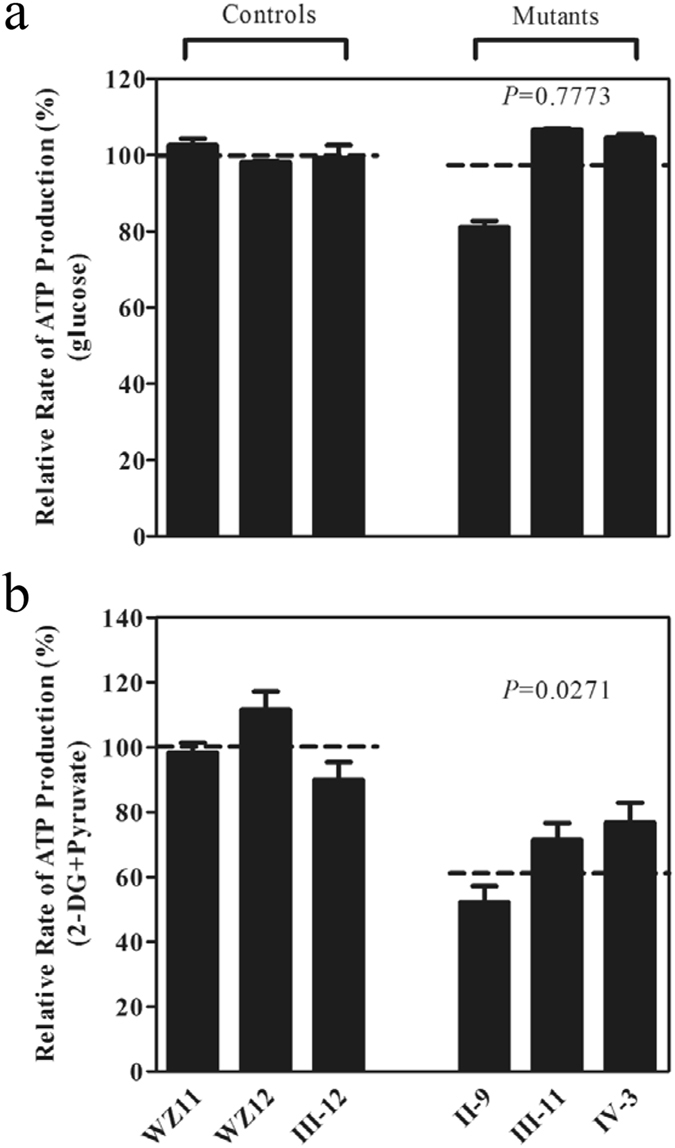
Figure 5.

Measurement of cellular and mitochondrial ATP levels using bioluminescence assay. Cells were incubated with 10 mM glucose or 5 mM 2-deoxy-D-glucose plus 5 mM pyruvate to determine ATP generation under cellular and mitochondrial ATP levels. Average rates of ATP level per cell line are shown: (a) ATP level in total cells and (b) ATP level in mitochondria. Six to seven determinations were made for each cell line. Graph details and symbols are explained in the legend to Fig. 2.
