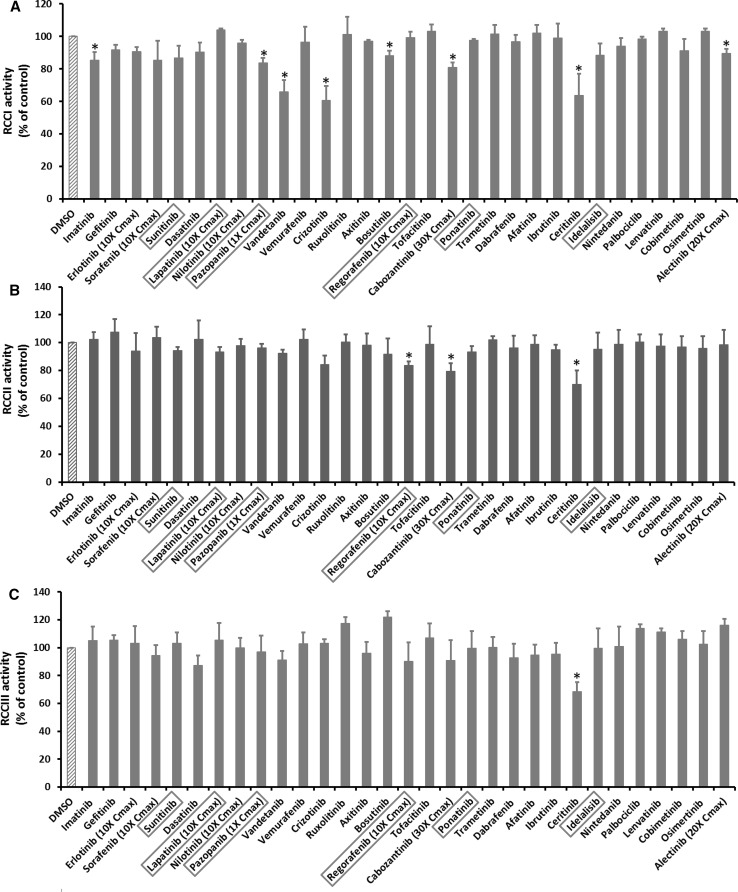
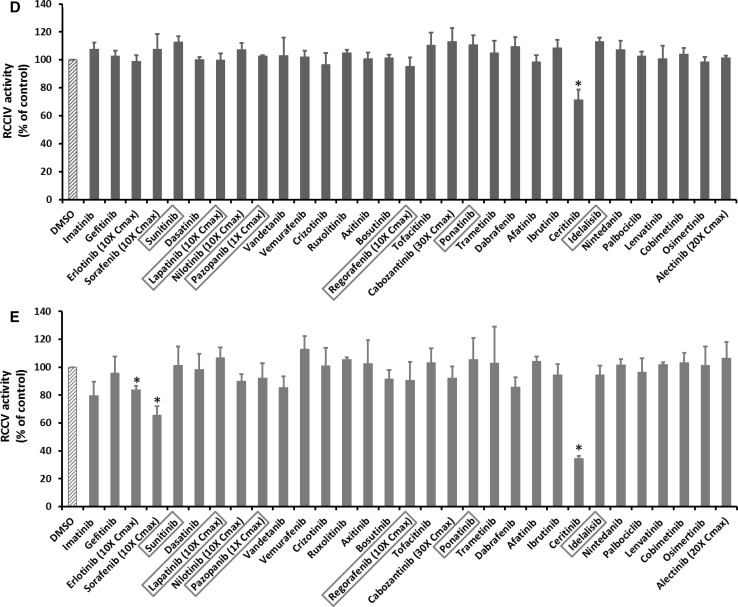
Fig. 2.
KI effects on activities of RCC I–V. Submitochondrial particles were incubated with KIs at 100-fold Cmax or the highest testable concentrations as. After 15 min, the activities of RCC I–V were measured. a, b, c, d, e Represents the activity of RCC I, II, III, IV, and V, respectively. The drugs in the X-axis were listed according to their approval date. The six KIs with a black box warning for hepatotoxicity were highlighted in a red box. The Y-axis represents the percentage of RCC activity after KI treatment as compared to DMSO-treated samples which were set as 100. Data are means and standard derivations from three independent experiments. *p < 0.05 as compared to DMSO-treated samples (color figure online)


