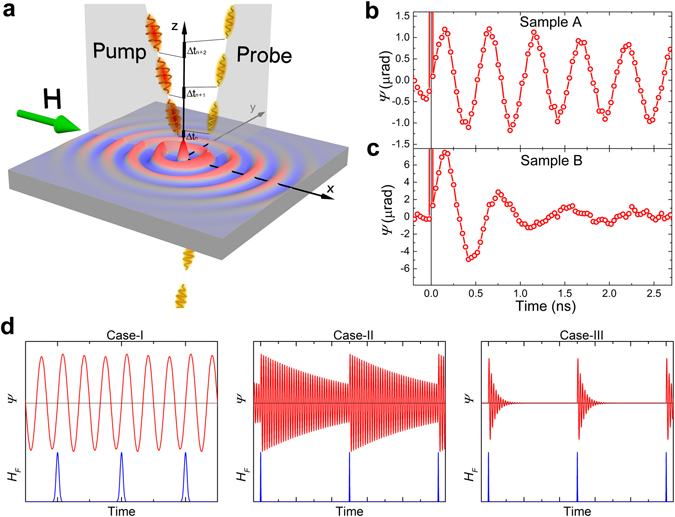
Figure 1.

Excitation of the magnetization dynamics by the periodic pulses. (a) Scheme of the pump-probe experiment. The sample is illuminated with pairs of pump and probe pulses. The time delay between the pump and probe pulses varies Δt n from 0 to 2.6 ns. (b,c) Oscillations of the Faraday rotation of the probe beam polarization, demonstrating magnetization precession in the sample-A (b) and B (c) excited by the 80MHz-laser. The external magnetic field is 590 Oe. (d) Three considered cases of the ratio of the interval between pump pulses (T) and decay time of the magnetization precession (τ): (case-I), (case-II), and (case-III). Red curve represents the magnetization precession and the blue one represents effective magnetic field of the inverse Faraday effect.
