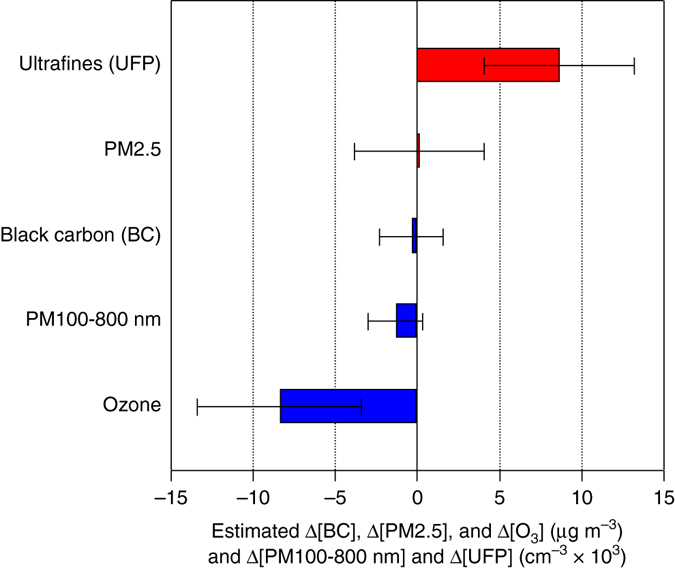
Fig. 1.

Estimated changes in pollutant concentrations. For varying composition, size range, and time-of-day window, in the São Paulo metropolitan area as the gasoline share in the flex-fuel fleet rises from 30 to 80 percentage points. Submicron particles and BC correspond to readings at 08:00, PM2.5 are 24-h means, and ozone are afternoon means between 12:00 and 16:00. Sample periods are January to May 2011 for submicron particles, October 2010 to April 2011 and October to November 2012 for BC, and November 2008 to May 2013 for PM2.5 and ozone. 95% Confidence Intervals (CI) are shown. Source: Specifications reported in Table 2
