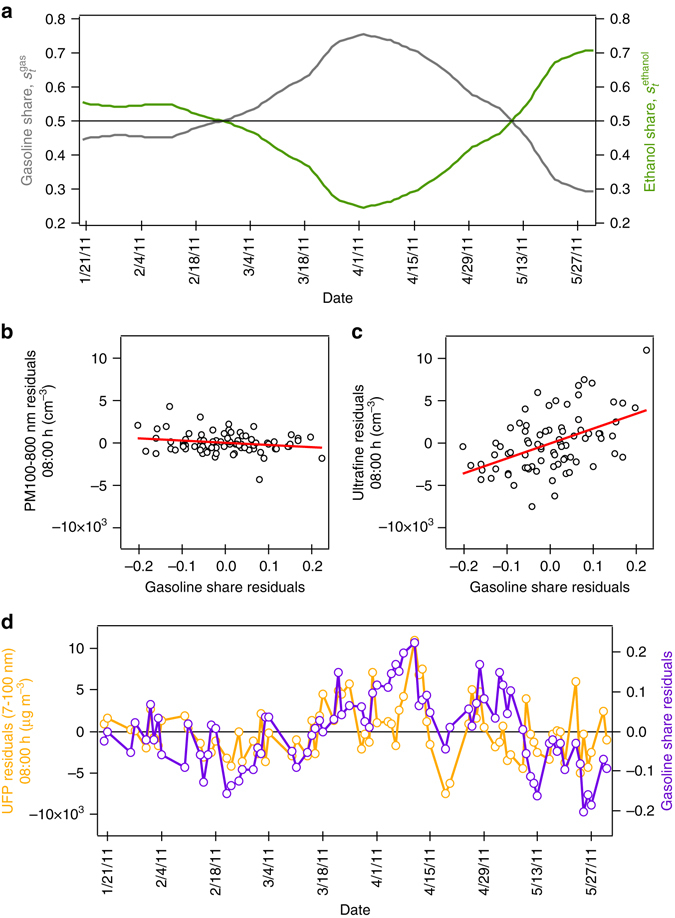
Fig. 2.

Submicron particles and the gasoline share. a Fuel share variation among flex-fuel vehicles from January to May 2011. b Co-variation of PM 100–800 nm and c ultrafine number concentration residuals with gasoline share residuals for the weekday morning hour of 08:00 in the same period. The red line marks the best linear predictor. d Morning-hour variation of ultrafine number concentration and gasoline share residuals over the period. Source: Specifications reported in Table 2
