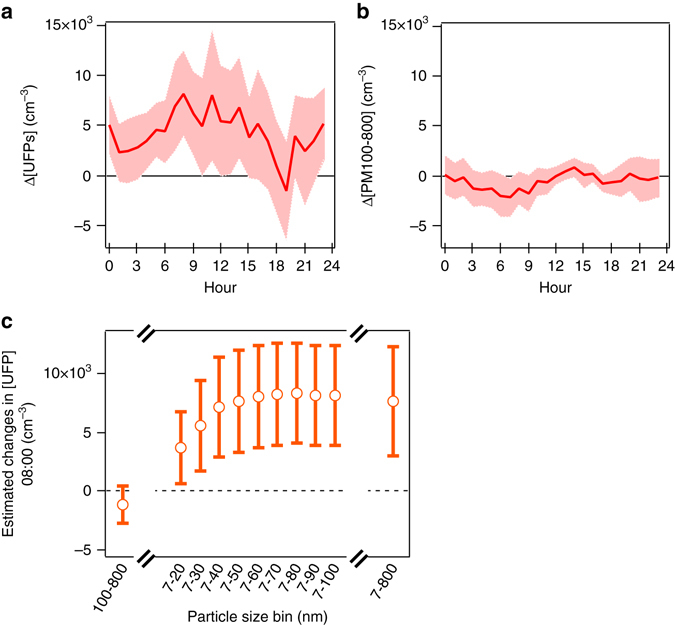
Fig. 4.

Estimated changes over weekday diurnal cycle. a 7–100 nm and b 100–800 nm particle concentration levels, over the weekday diurnal cycle, associated with a 50-percentage-point rise in gasoline use in the flex-fuel fleet, from 30 to 80%. For clarity, for every hour of the day we plot the 95% CI for the gasoline share’s association with the 7–100 nm size range a, and the 95% CI for the gasoline share’s association with the 100–800 nm size range b. c Opening the 7–20 nm size bin towards 800 nm, and comparison to the 100–800 nm bin, for the weekday morning hour of 08:00. For clarity, for 08:00 we plot the CI for the gasoline share’s association with every size bin. Source: Specifications reported in Supplementary Table 8 B, D, with sample period restricted to the summer/fall months of January to May 2011 and trend included as seasonality control (same specifications as Table 2 for 7–20 nm and 100–800 nm at 08:00)
