Figure 1.

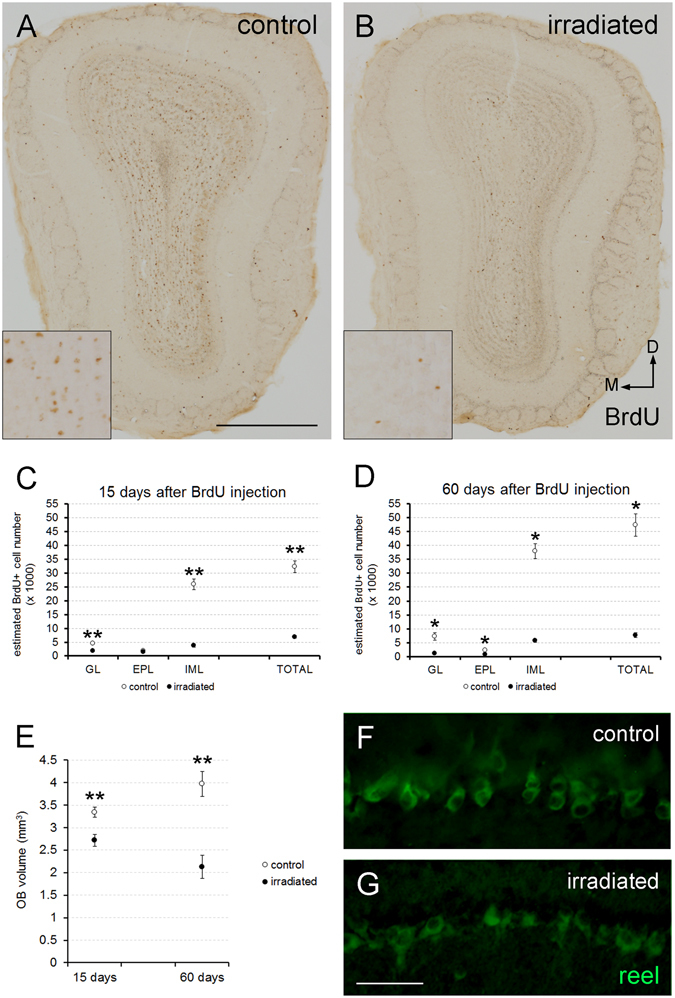
Effect of radiation in cell turnover, OB volume and mitral cells. (A,B) Coronal slices of the OB from control and irradiated mice 15 days after BrdU injection; note the reduction in BrdU staining; inset panels enlarge representative areas to show the differences between both situations. (C,D) Estimation of BrdU-positive cells in the different OB layers 15 (C) and 60 days (D) after BrdU injection; note the reduction in the number of cells in the irradiated animals except for the EPL 15 days after BrdU injection. (E) Estimation of the OB volume; note the dramatic reduction in irradiated animals at both survival times. (F,G) Mitral cells of both experimental groups stained with reelin (green); no differences were detected. M, medial; D, dorsal. *p < 0.05; **p < 0.01. Scale bar 500 μm for (A,B); 100 μm for (F,G).
