Figure 3.

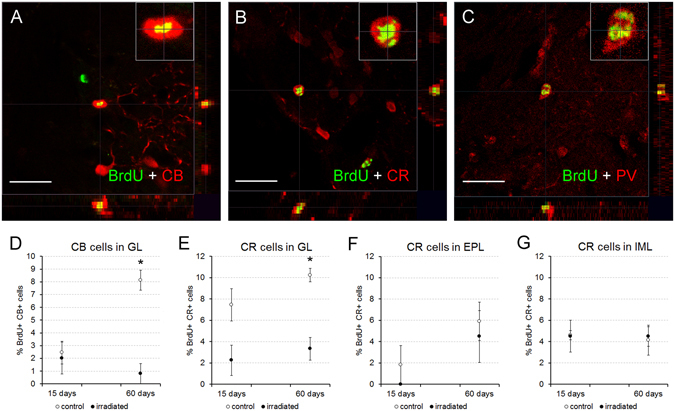
Cell characterization. (A–C) Focal planes with 3D stacks showing co-localization between BrdU (green) and calbindin (CB, red; A), calretinin (CR, red; B) or parvalbumin (PV, red; C); inset panels show a higher magnification of double-labelled cells; images correspond to control mice of 60 days of survival. (D–G) Charts showing the percentages of co-localization between BrdU and the other markers; differences for both CB (D) or CR (E–G) were focused on the glomerular layer 60 days after BrdU injections (E). *p < 0.05. Scale bar 20 μm.
