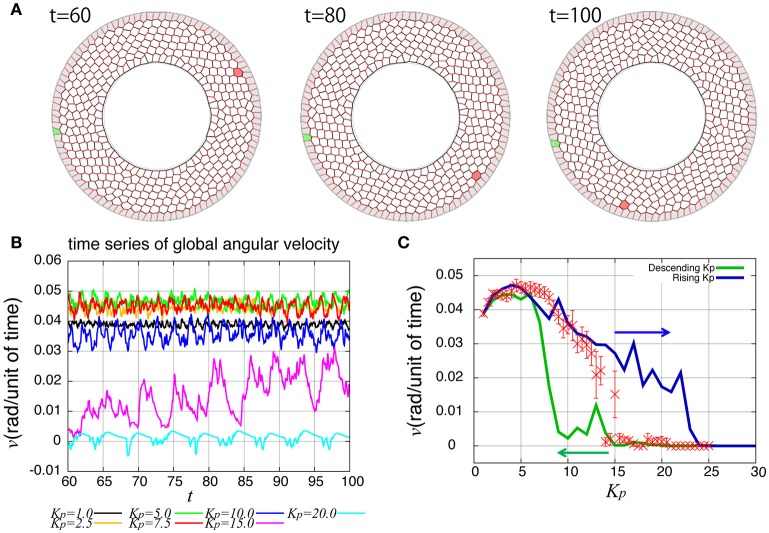
Figure 2.
Rotational motion of the genital disc in the absence of line tension fluctuation. (A) Time-lapse images of genital disc rotation. (B) Time evolution of global angular velocity for various values of Kp. (C) Kp-dependence of the global angular velocity. The angular velocity was averaged over the time window from t = 60 to 100 (red). Error bars indicate the standard deviation in the time course. Hysteresis curves for the global angular velocity were plotted for increasing and decreasing parameter values (blue and green lines, respectively).

