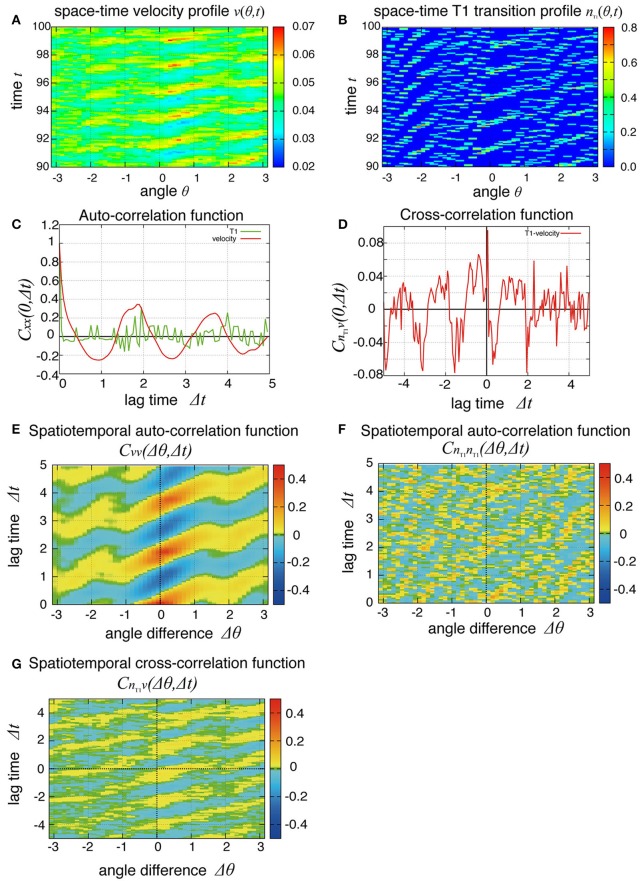
Figure 4.
Spatial propagations of cellular motility and T1 transition frequency. (A,B) Spatiotemporal distributions of local angular velocities (A) and frequency of T1 transitions (B) for Kp = 7.5. (C–G) Spatiotemporal correlation functions for Kp = 7.5 in the absence of oscillation of chiral line tension. A schematic explanation of spatiotemporal correlation function is shown in Supplementary Figure 1. (C) Temporal auto-correlation of the local angular velocity (red line) and the T1 transition (green line). (D) Temporal cross-correlation function. (E) Spatiotemporal auto-correlation of the local angular velocity. (F) Spatiotemporal auto-correlation of the local frequency of T1 transition. The max/min color was plotted when the color value exceeded the max/min of the color bar. (G) Spatiotemporal cross-correlation CnT1v(Δθ, Δt) = 〈δnT1(θ, t) δv(θ+Δθ, t+Δt)〉/σnT1σv between fluctuations of the local angular velocity and the frequency of T1 transition. θ and Δθ here are defined in the clockwise direction. (F,G) The auto-correlations (F) and the cross-correlations (G) along the time axis of Δθ = 0.

