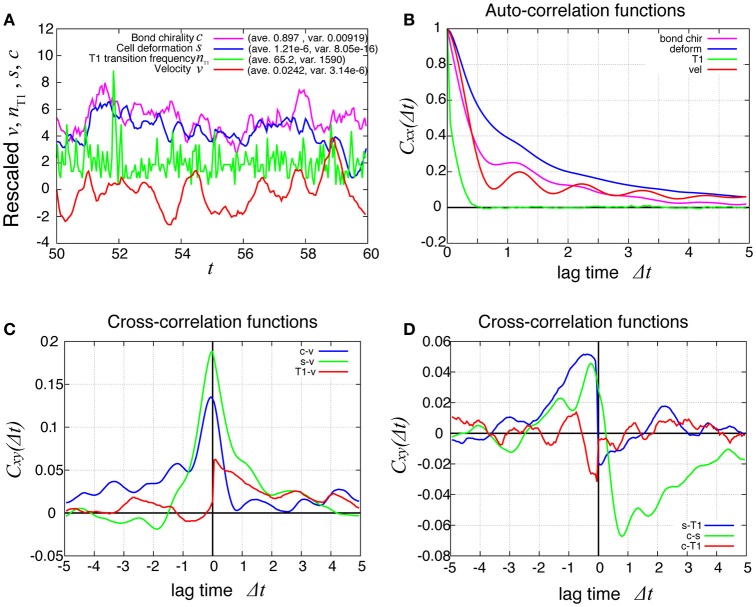
Figure 8.
Dynamics and correlation functions for Kp = 7.5 in the presence of line tension fluctuation, showing a weak oscillation in cell motility and the correlations with other quantities. (A) Time evolutions of the average angular velocity (red curve), the number of T1 transitions per unit time (green curve), the average s (blue curve), and the bond chirality c (purple curve) in the time window from t = 50 to 60. The quantities x = v, nT1, s, c plotted in this figure were rescaled as (x − 〈x〉)/σx, respectively, with the average 〈x〉 and standard deviation σx. The plots are offset by 2 (nT1), 4 (s), and 6 (c), for visibility. (B) Auto-correlations of v, nT1, s, and c. (C) Cross-correlation functions between v and the other quantities, given by Cxv(Δt) = 〈δx(t)δv(t + Δt)〉/σxσv, where x is nT1, s, or c (red, green, and blue, respectively). Here, the positive time difference Δt means that x precedes v. δx = x − 〈x〉. (D) Cross-correlation functions given by CsnT1(Δt) = 〈δs(t)δnT1(t + Δt)〉/σsσnT1, Ccs(Δt) = 〈δc(t)δs(t + Δt)〉/σcσs, and CcnT1(Δt) = 〈δc(t)δnT1(t + Δt)〉/σcσnT1.

