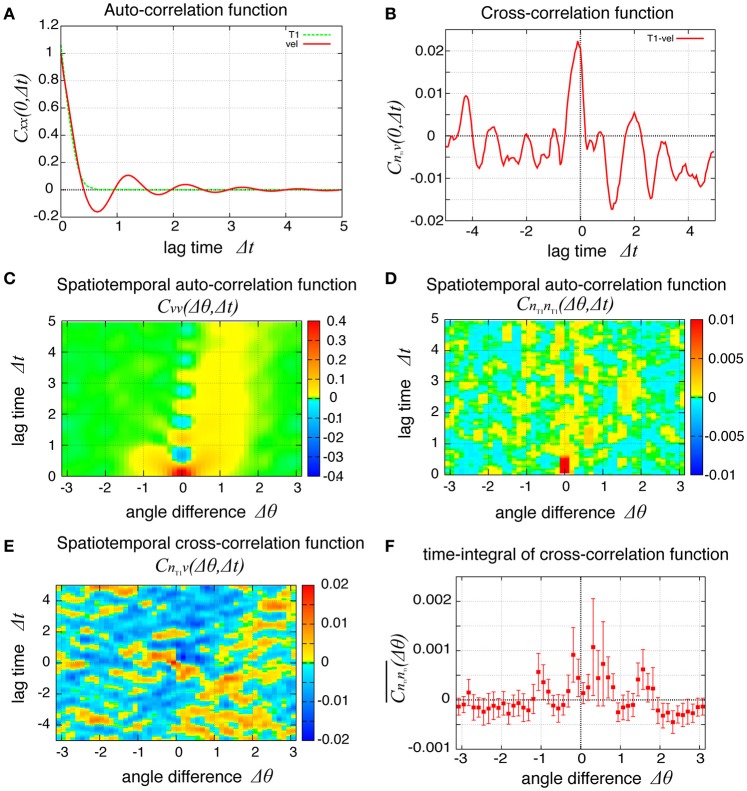
Figure 9.
Spatiotemporal correlation functions for Kp = 7.5 in the presence of chiral line tension fluctuation, showing the spatial propagation of cell rearrangements. (A) Temporal auto-correlation function of the local angular velocity and the local frequency of T1 transitions (red and green lines, respectively). (B) Temporal cross-correlation function between the two quantities. (C,D) Spatiotemporal correlation function of the local angular velocity (C) and the local frequency of T1 transition (D). (E) Spatiotemporal correlation function between the two quantities. (F) Integrated spatiotemporal correlation of (D) along the time difference between Δt = 1 and Δt = 5, given by , where C is the spatiotemporal correlation function. To obtained the plot, 132 simulations were carried out with different values of the random parameters, the frequency fkl and the initial phase δkl of tension fluctuation. The integration was first performed for each simulation. Then, the means over the 132 simulations were plotted (marks) against the angle difference Δθ. Vertical bars indicate 95 percent confidence intervals of the means among the 132 simulations.

