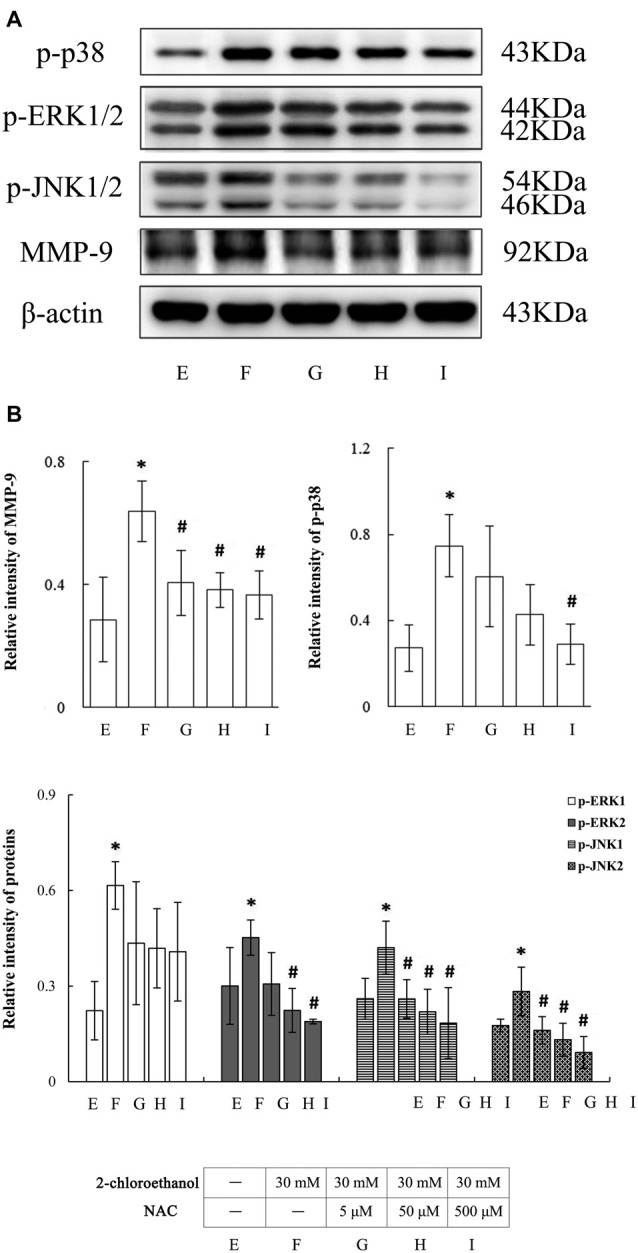
Figure 6.

Involvement of ROS in activation of MAPK signal pathways in primary cultured astrocytes exposed to 2-chloroethanol. Notes: 2-CE, 2-chloroethanol. Cells in the exposure group and NAC intervention groups were exposed to 30 mM 2-CE. Cells in the intervention groups were pre-exposed with NAC 1 h before 2-CE exposure. (A) Western blot analysis. Images were the representative results of four separate experiments for each group. (B) Densitometric analysis of western blots. The relative intensity in arbitrary units was compared to β-actin. Bands of p-ERK1/2 or p-JNK1/2 were calculated separately. Data were expressed as mean ± SD of four independent experiments performed on four batches of primary cultured astrocytes, and analyzed by One-way ANOVA. Significant difference was defined as p < 0.05, and *, vs. blank control; #, vs. 30 mM 2-CE exposure group.
