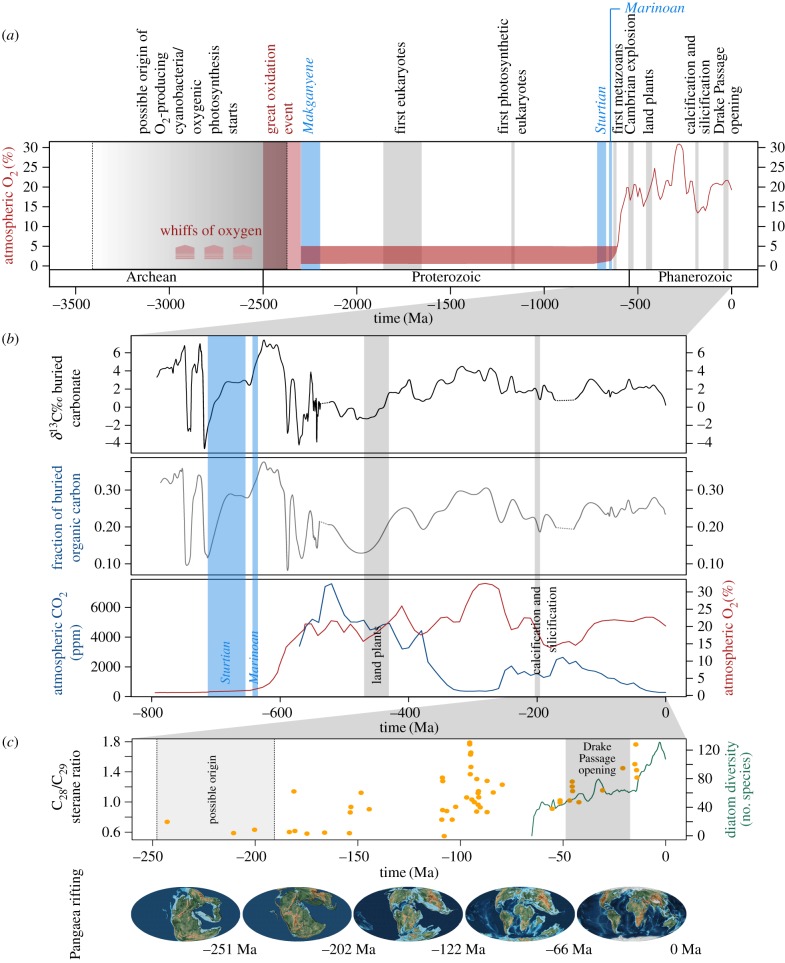
Figure 1.
Major evolutionary and biogeochemical events during the history of life on Earth. (a) Trends since the evolution of oxygenic photosynthesis, (b) trends during the last 800 million years, and (c) diatom diversity and abundance data with respect to Pangaea rifting during the last 260 million years. Atmospheric O2 was modified from Holland [7] according to Lyons et al. [8]; it is compared to δ13C of carbonates [9], fraction of buried organic carbon [9], atmospheric CO2 [10], diatom diversity [11] and C28/C29 sterane ratios [12], which is a geochemical proxy for diatom abundance. Snowball Earth events are shown in light blue and were taken from Hoffman and Kopp et al. [13,14]. Pangaea rifting is illustrated with maps taken from the PALEOMAP Project [15]. The grey ranges on the plots represent the estimated span of the events cited in the text. Note that because the oldest direct measurements of atmospheric O2 come from Pleistocene ice cores, all the detail in the Phanerozoic curve is based on models. Prior to that we have represented the views of Lyons et al. [8]: no stable O2 trends before the Great Oxidation Event, some atmospheric O2 (1–5%) through most of the Proterozoic, and then a rise to more or less modern values from the Ediacaran to the Silurian. The case is strong that pO2 during the Carboniferous was higher than today's, but other details in the Phanerozoic curve are conjectural.

