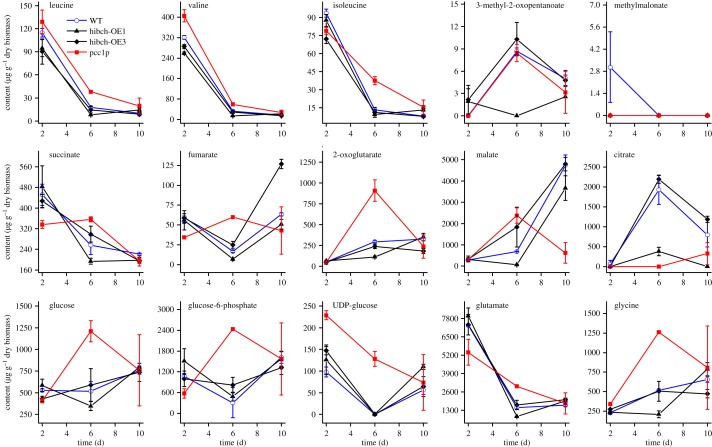
Figure 3.
Metabolite contents in wild-type (WT), two HIBCH overexpression lines (hibch-OE1 and hibch-OE3) and one PCC1 RNAi line (pcc1p) grown in f/2 (NaNO3 concentration was reduced to 500 µM) enriched artificial seawater media at day 2, 6 and 10. Error bars represent s.e. of three biological replicates.

