
FIGURE 3.
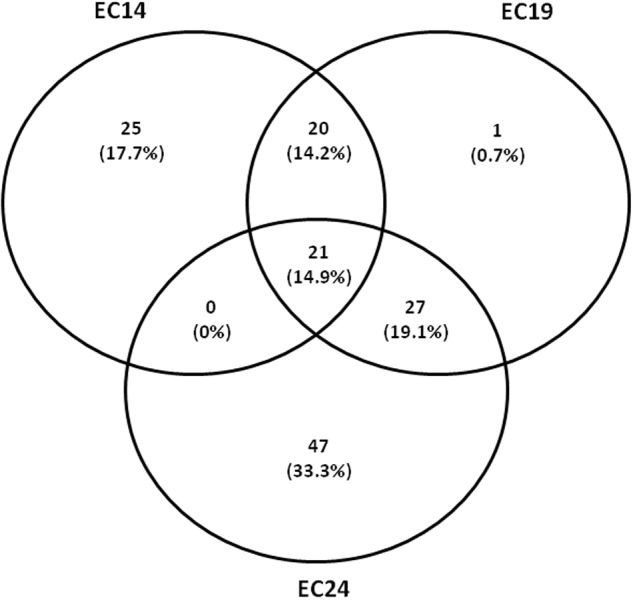
Overlap between differently expressed genes (greater than or equal to 30-fold, p-value < 0.05) on exposure to ciprofloxacin (1 μg/mL) between low-level quinolone resistant (LLQR) cells compared to the wild-type cells in the same conditions. Venn diagram shows the overlap. The numbers indicated on the diagram refer to the number of genes with significantly altered expression levels in one or both conditions. LLQR phenotypes: EC14 means E. coli ATCC 25922 pBK-QnrS1; EC19 means E. coli ATCC 25922 ΔmarR pBK-QnrS1; and EC24 means E. coli ATCC 25922 S83L pBK-QnrS1.