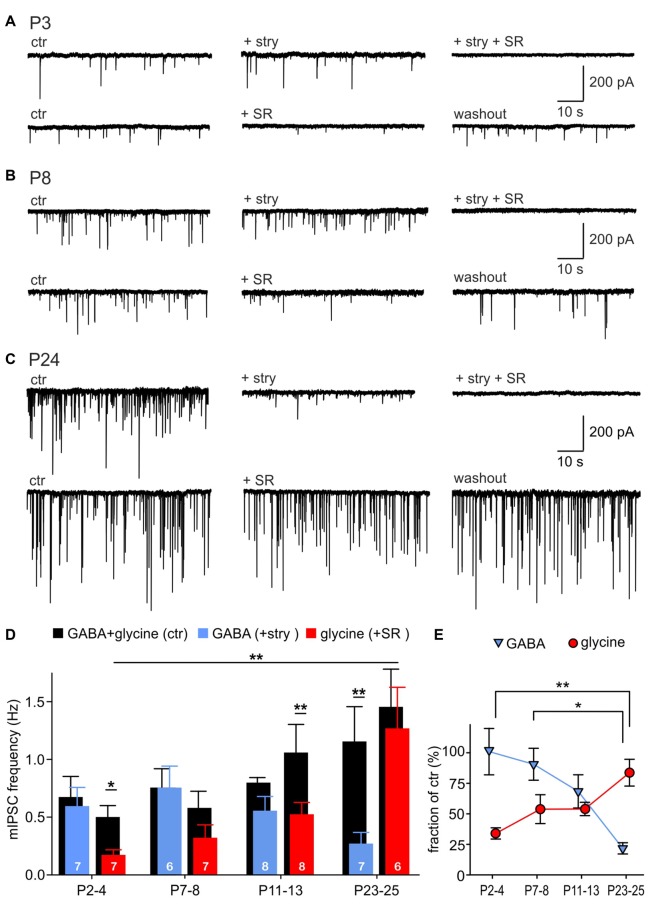
Figure 2.
Developmental shift of inhibitory vesicle content. (A–C) Example recordings of mIPSCs at P3 (A), P8 (B) and P24 (C). mIPSCs were differently affected by 0.5 μM strychnine or 15 μM SR95531 depending on the maturity. Combination of both antagonists completely blocked mIPSCs. (D) Mean frequencies of isolated glycinergic and GABAergic mIPSCs and respective controls at different ages (mean ± SEM; *p < 0.05, **p < 0.01, two-way repeated-measures (RM) ANOVA, cell numbers are given at the bottom of the bars). (E) Relative GABAergic and glycinergic contributions to the total mIPSC frequency at different ages (mean ± SEM; *p < 0.05, **p < 0.01, ANOVA).

