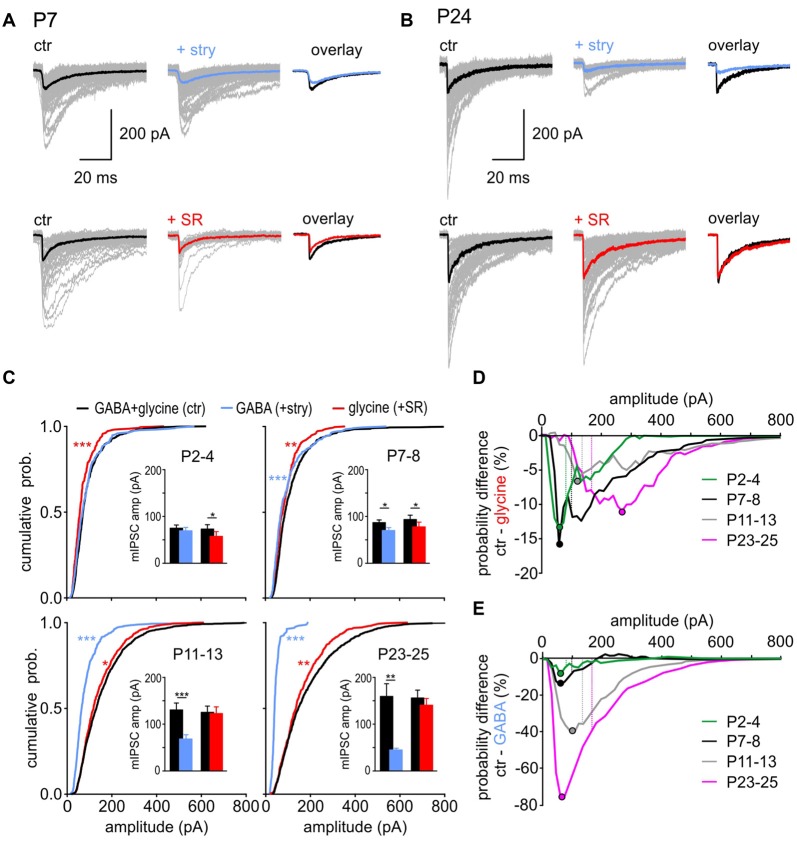
Figure 3.
GABA and glycine contribution to mIPSC amplitudes. (A,B) Superimposed individual mIPSCs (gray), with respective median for control (black), GABAergic (blue) and glycinergic (red) events from representative SBCs at P7 (A) and P24 (B). Right: overlay of the median mIPSCs before and after the respective drug application. (C) Left: mean CDFs of control, GABAergic, and glycinergic mIPSC amplitudes at different postnatal ages (ctr vs. transmitter: *p < 0.05, **p < 0.01, ***p < 0.001, K-S test). Insets show summary data for median amplitudes before and after block of glycine receptor (GlyR) (+stry) or GABAAR (+SR) (bars represent the mean amplitude of the respective age group ± SEM calculated from the median amplitudes per cell; transmitter vs. respective control: *p < 0.05, **p < 0.01, ***p < 0.001, paired t test). (D,E) Difference curves obtained by subtraction of glycinergic CDF (D) or GABAergic CDF (E) from control CDFs. The curves show the probability difference for events evoked by each transmitter compared to control events. Filled circles show the mIPSC amplitude at which the maximal difference was observed between the isolated glycine (D) or GABA (E) events and the respective control. For better comparison, dashed lines represent the mean mIPSC amplitude of control cells for each age group.

