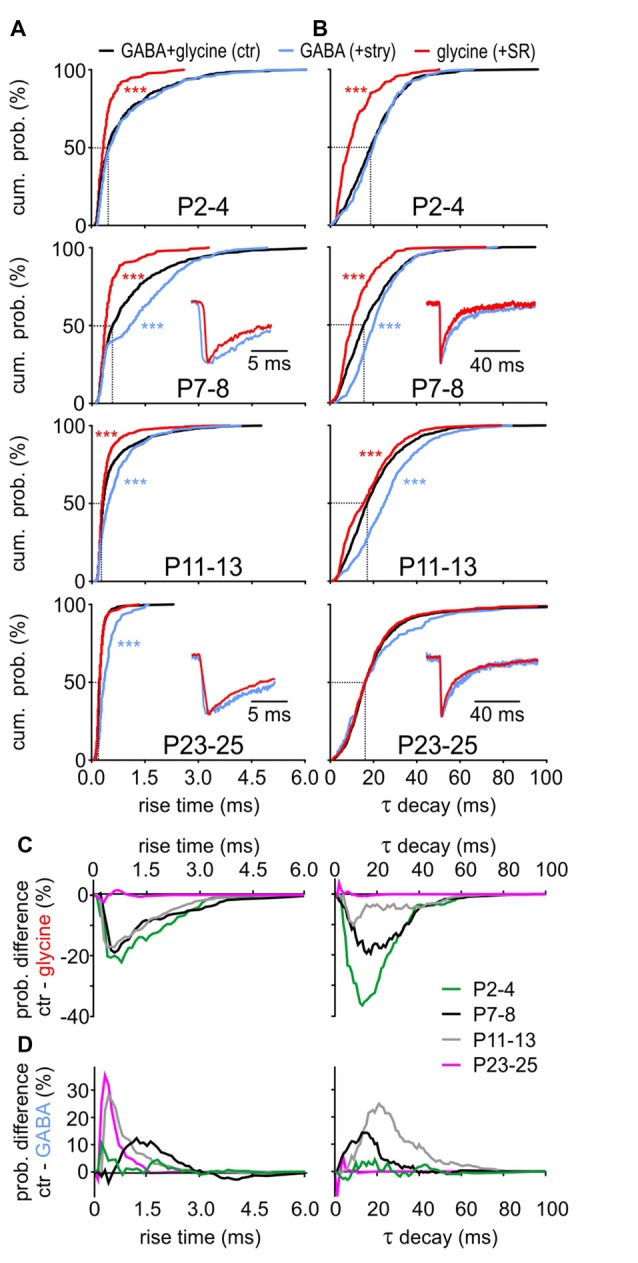
Figure 4.

Contribution of GABA and glycine to mIPSC kinetics. (A,B) Mean CDFs of (A) rise times and (B) decay time constants at different postnatal ages for control, isolated GABAergic and glycinergic mIPSCs (ctr vs. transmitter: ***p < 0.001, K-S test). Insets show overlay of normalized median traces for representative cells at different ages. (C,D) Difference curves obtained by subtraction of glycinergic CDF (C) or GABAergic CDF (D) from respective control CDF for mIPSC rise time (left) and τ decay (right). The probability difference for rise time and τ decay between glycinergic and control mIPSCs decreased with maturation. Due to developmental shortening of the rise time for control events, the probability difference was progressively larger for maturing isolated GABAergic events (D, left). The decay time of glycinergic mIPSCs shortens with development (B) to reach values comparable to control at P23–25 (D, right).
