Figure 6.
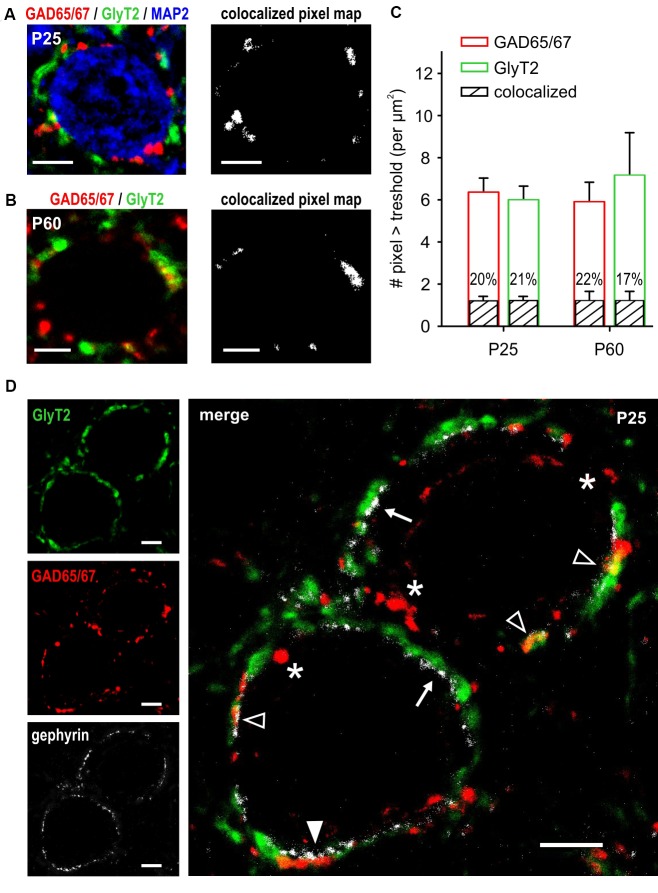
Partial colocalization of GABAergic and glycinergic presynaptic markers throughout adulthood. (A,B) Confocal images of GAD65/67 (red) and GlyT2 (green) labeling showing the allocation of putative GABAergic and glycinergic synaptic terminals at P25 (A) and P60 (B). Additional staining with MAP-2 shows somatic localization of inhibitory terminals on the large SBCs (blue). Maps on the right show colocalized pixels (intensity above threshold in both channels) from the composite confocal images on the left. Partial colocalization of GAD65/67 and GlyT2 is present both at P25 and P60. (C) Population data showing GAD65/67 (red) and GlyT2 (green) pixels above respective threshold at P25 (n = 40 cells) and P60 (n = 24 cells). The amount of GAD65/67- and GLYT2-positive pixels is comparable within and between the age groups (p > 0.2, ANOVA). Black bars indicate the mean ± SEM number of colocalized pixels in both age groups. Percentages showing the relative fraction of colocalized pixels within the respective bar indicate a stable proportion of terminals releasing both GABA and glycine (P25 vs. P60, p = 0.8, ANOVA). (D) Gephyrin staining (white) indicates putative localizations of the postsynaptic GABAAR and/or GlyR. Merged image on the right shows gephyrin in apposition to GlyT2-positive terminals (arrows), to GAD65/67-positive terminals (white arrowhead), and to terminals colocalizing GlyT2 and GAD65/67 (empty arrowheads). Note the terminals expressing only GAD65/67 with no gephyrin staining on the postsynaptic site of the membrane (asterisks). Scale bars = 5 μm (A–D).

