
Figure 1.
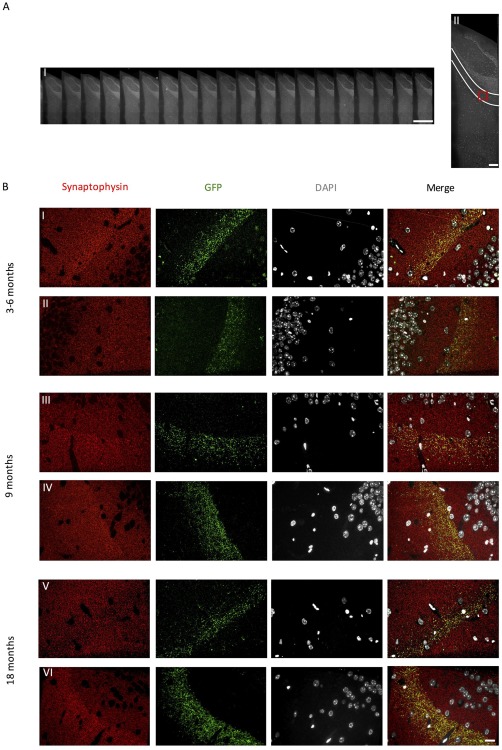
Synaptic images were obtained from the MML of the dentate gyrus from each section along the entire array ribbon (A.I–II). GFP expression is evident in the middle molecular layer of the dentate gyrus (B) of (I) 3–6 month (III) 9 month and (V) 18 month old rTgTauEC + EC‐tdTomato/Syp‐GFP mice and (II) 3–6 month (IV) 9 month and (VI) 18 month old EC‐tdTomato/Syp‐GFP control mice. Scale bars represent 1 mm in A(I), 200 μm in A(II), and 20 μm in B(I–VI)