
Figure 2.
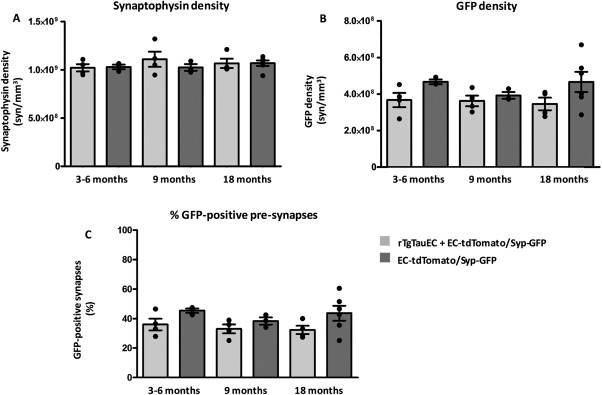
Quantification of synaptic density with array tomography. (A) total presynapses detected by synaptophysin immunolabeling, (B) GFP‐positive presynapses, (C) % GFP‐positive presynapses in the MML of the dentate gyrus. Data shown are means ± SEM, individual points represent the mean value from each mouse